Research · Public Sector
Citizen Satisfaction Surveys for Government
A public-sector experience program that captures citizen needs, feedback, and priorities across services and jurisdictions, benchmarks satisfaction and trust, and isolates what builds confidence and where to invest, so agencies can plan services, improve them, and prove progress.
What it does
Turn citizen needs and feedback into better services and trust.
Capture needs and feedback at scale
Citizen needs, priorities, and feedback are gathered across programs, channels, and jurisdictions, so planning and service improvement start from evidence.
Benchmark across jurisdictions
Satisfaction and trust are compared across cities and counties, so leaders see where service leads or lags peers.
Identify what builds trust
Driver analysis isolates the service factors that move citizen trust, so resources go where they rebuild confidence.
Track sentiment over time
Sentiment and friction are tracked continuously, so agencies can prove that changes actually improved the experience.
How it works
A clear path from start to result
Define the scope
Agree the services, programs, and jurisdictions to measure, and the citizen needs and priorities to surface, so citizen voice maps to real decisions.
Collect feedback
Gather citizen input across channels and touchpoints with accessible, inclusive methods.
Analyze and benchmark
Score satisfaction and trust, benchmark across jurisdictions, and locate the service gaps.
Surface drivers
Identify the factors that move trust and the friction points that erode it.
Report and improve
Deliver transparent dashboards and a roadmap that shows progress over time.
Powered by the Hub
Run it continuously, on web and mobile
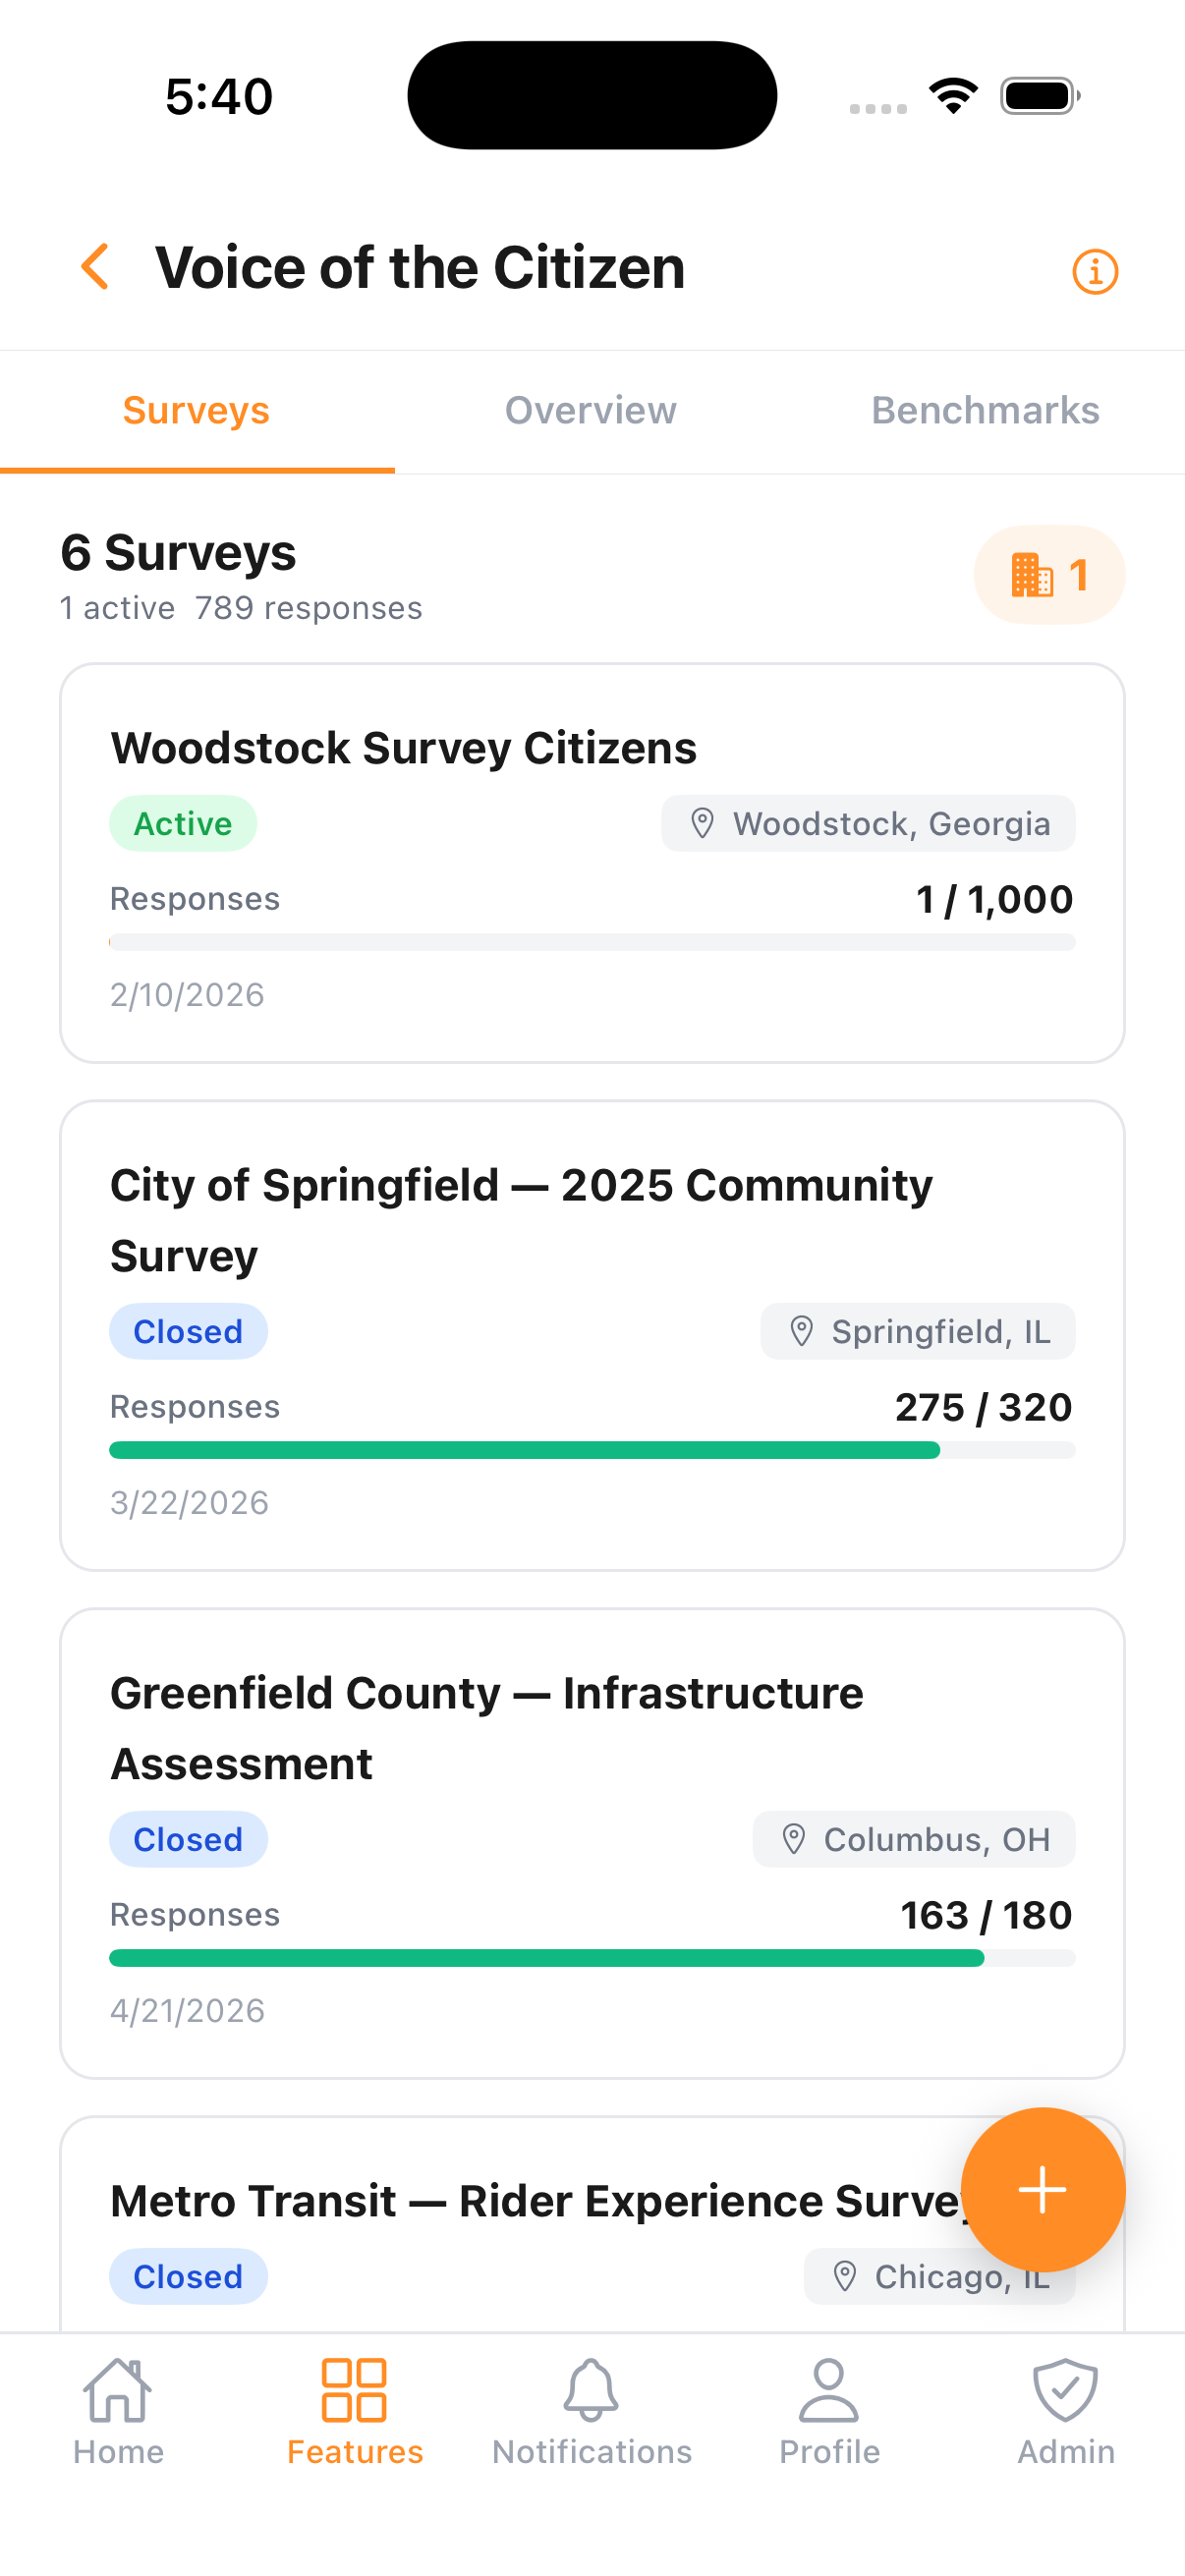
- Citizen feedback programs across cities and counties
- Benchmarks across participating jurisdictions
- Behavioral analytics and journey visualization
- Integrated feedback tied to real behavior
- Web and mobile access included
What you get
Deliverables you can act on

Citizen dashboard
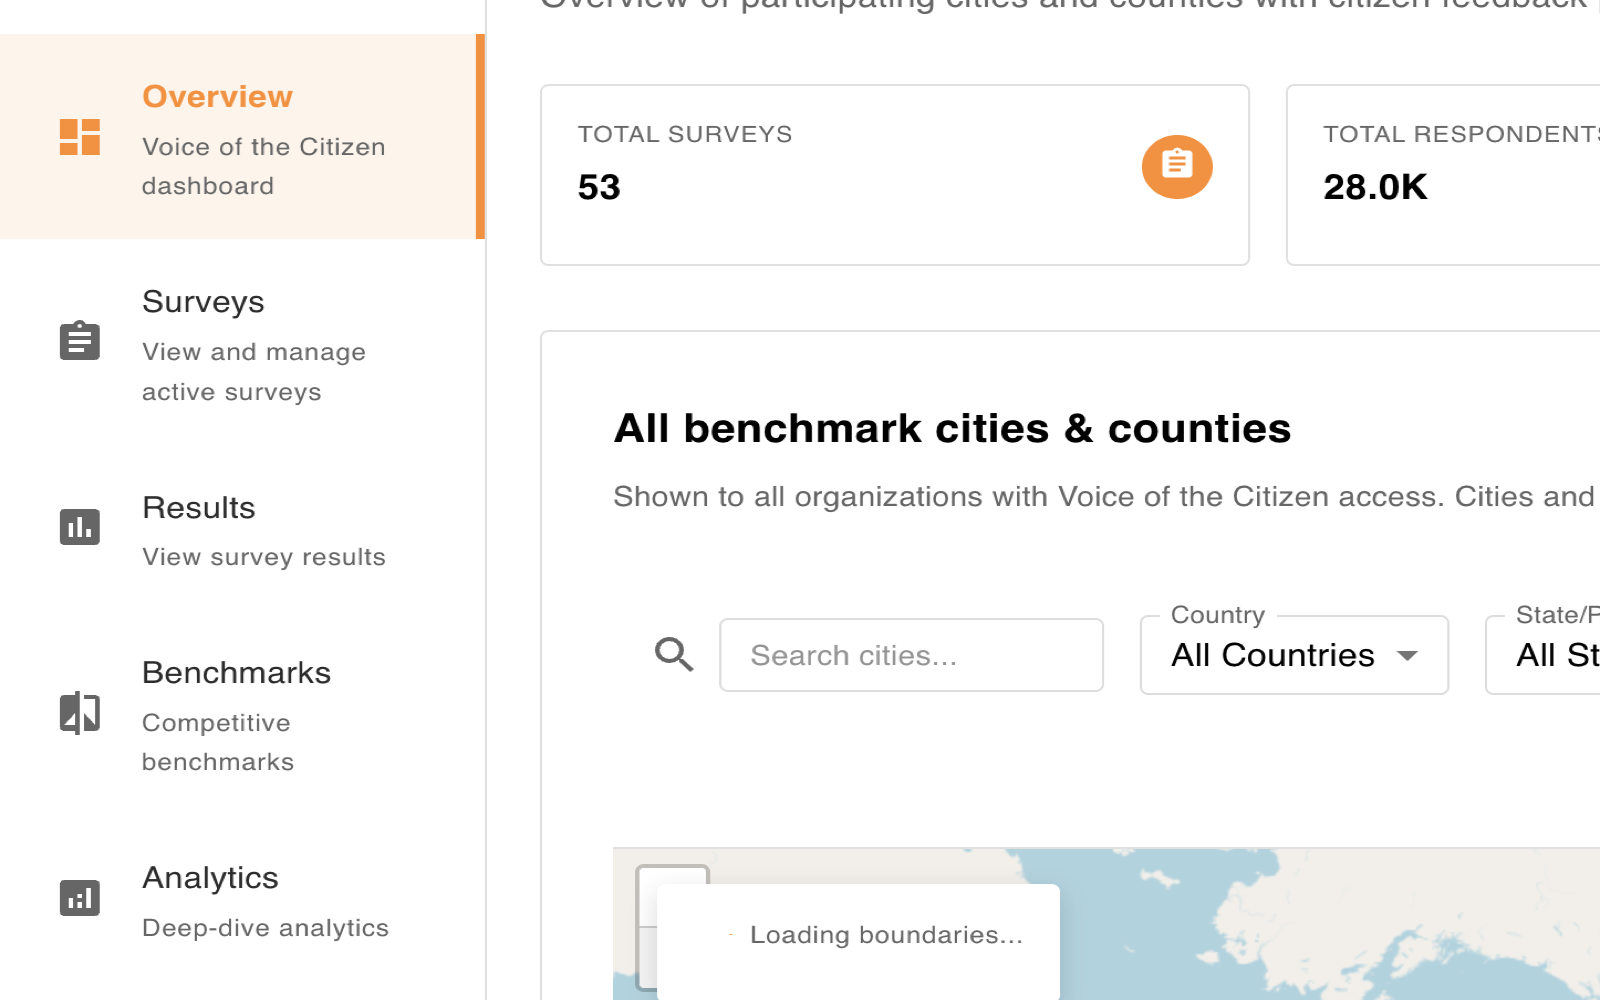
The leadership view: the headline public-service KPIs, from satisfaction with recent interactions to a trust index.

Drivers of trust
The service factors that move citizen trust, ranked by influence, so resources rebuild confidence where it counts.

Benchmark by jurisdiction
Satisfaction scored across participating cities and counties, so each jurisdiction sees how it performs against peers.

Sentiment mix
How citizen sentiment splits across positive, neutral, and negative, the pulse behind the satisfaction number.
Methodology
Counting complaints isn't listening to citizens
Reacting to whoever shouts loudest skews services toward the vocal few. We assess real needs, benchmark trust across jurisdictions, and track whether services actually improved.
Ad hoc citizen feedback
- Driven by complaints and the loudest voices
- No benchmark across cities or counties
- Sentiment captured once, never tracked
- Findings don’t connect to service decisions
Intellimark Voice of the Citizen
- Captures resident needs and ranks services by satisfaction across categories
- Benchmarks satisfaction and trust across jurisdictions
- Analyzes the service drivers most linked to citizen trust
- Tracks improvement over time, not a one-off poll
Verified against established practice and research: OECD, what drives trust in public institutions (Trust Survey) · McKinsey, meeting public demand for better government service · Minelli & Ruffini (2018), citizen feedback for continuous improvement (IJPSM)
Market reality
Why this matters now
Common
questions
What is Voice of the Citizen? +
A program that brings citizen needs, feedback, and behavioral insight together so public services can be planned, measured, benchmarked, and improved.
Does it cover community needs assessment? +
Yes. It assesses resident needs and priorities to guide planning and resource allocation, alongside the satisfaction and trust tracking that measures how services perform.
How does benchmarking work? +
Satisfaction and trust are compared across participating cities and counties, so each jurisdiction sees how it performs against peers.
Who uses it? +
Public agencies and city and county leaders responsible for service quality, citizen trust, and program outcomes.
What do you get? +
A citizen feedback dashboard, cross-jurisdiction benchmarks, driver analysis of trust, and a roadmap for improvement.