Research · Customers & Employees
Digital Experience Analytics
Behavioral analytics for websites, web apps, and mobile that show how users really move through your product and where friction costs conversions — plus hands-on UX and build support to redesign flows and ship the fixes, so digital experience is measured, improved, and proven.
What it does
Measure and improve how users experience your websites and apps.
See real user journeys
Native web and mobile SDKs track how users actually move through your product, so behavior is measured, not assumed.
Pinpoint friction and drop-off
Funnels and path analysis show exactly where users stall or leave, so fixes target the steps that lose conversions.
Tie behavior to feedback
In-flow feedback connects what users do with what they say, so you understand the why behind every drop-off.
Build and ship improvements
When analysis points the way, we help redesign journeys, refine websites and apps, and implement the changes — not just deliver a report.
How it works
A clear path from start to result
Instrument the product
Deploy web and mobile SDKs to capture real user behavior across the flows that matter.
Map the journeys
Visualize paths, funnels, and sessions to see how users move and where they stall.
Find the friction
Quantify drop-offs, errors, and usability gaps in the flows that drive outcomes.
Connect to feedback
Tie behavioral signals to in-flow feedback to explain the why behind the numbers.
Build, ship, and prove
Redesign and implement the prioritized fixes on your site and in your app, then measure lift over time.
Powered by the Hub
Run it continuously, on web and mobile
- Native event tracking via web and mobile SDK
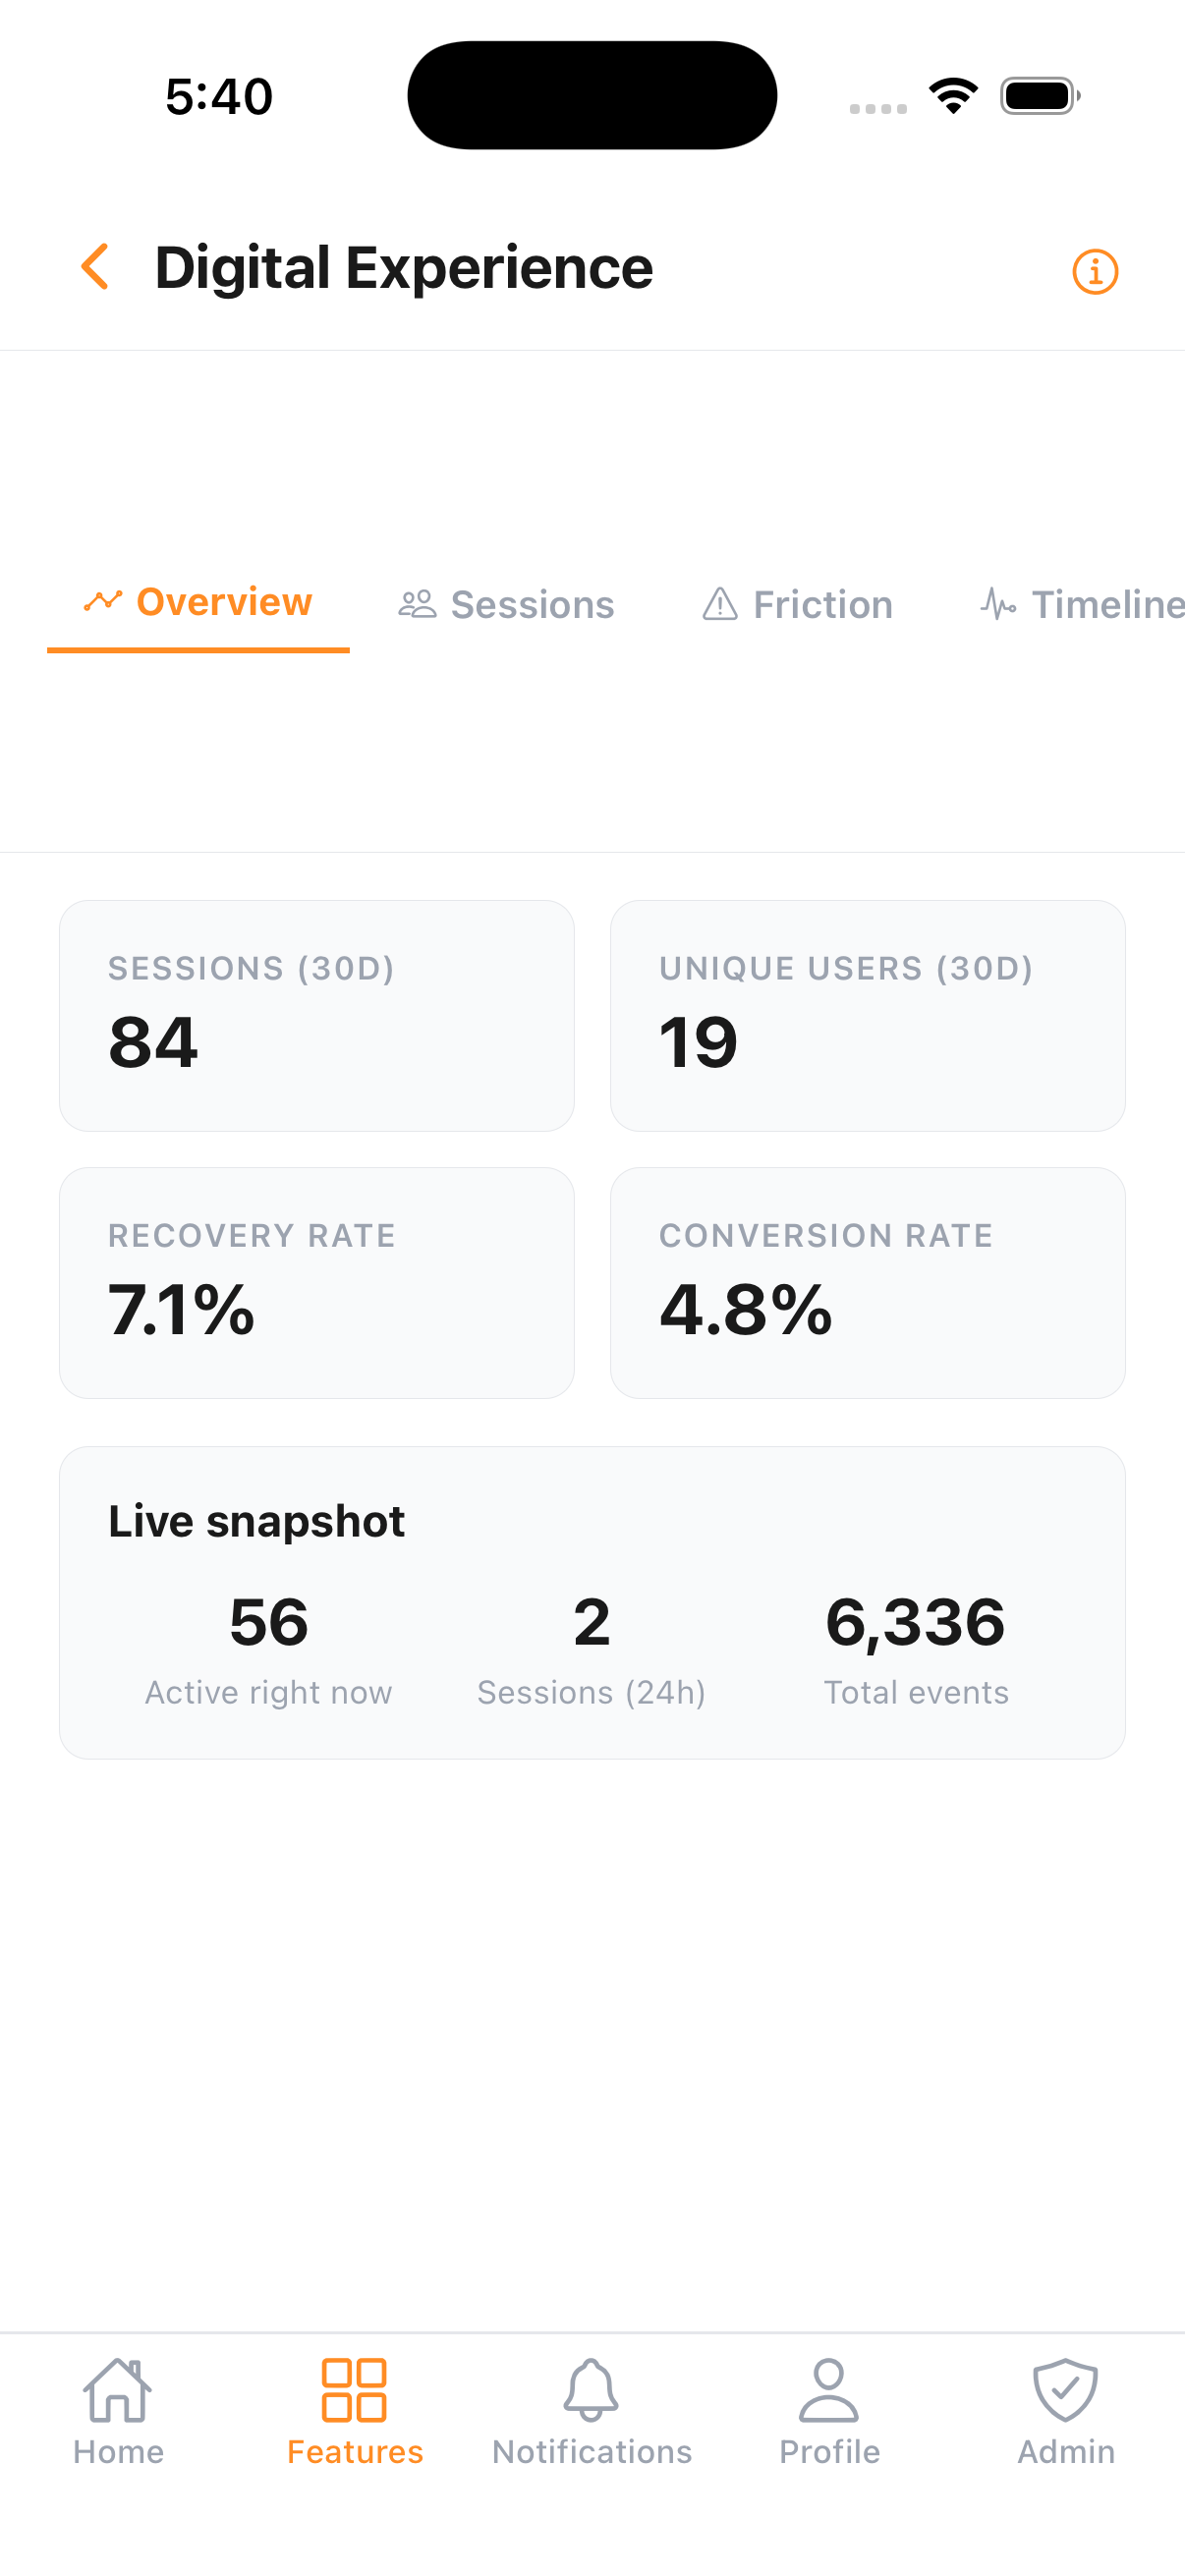
- Real-time journey and funnel visualization
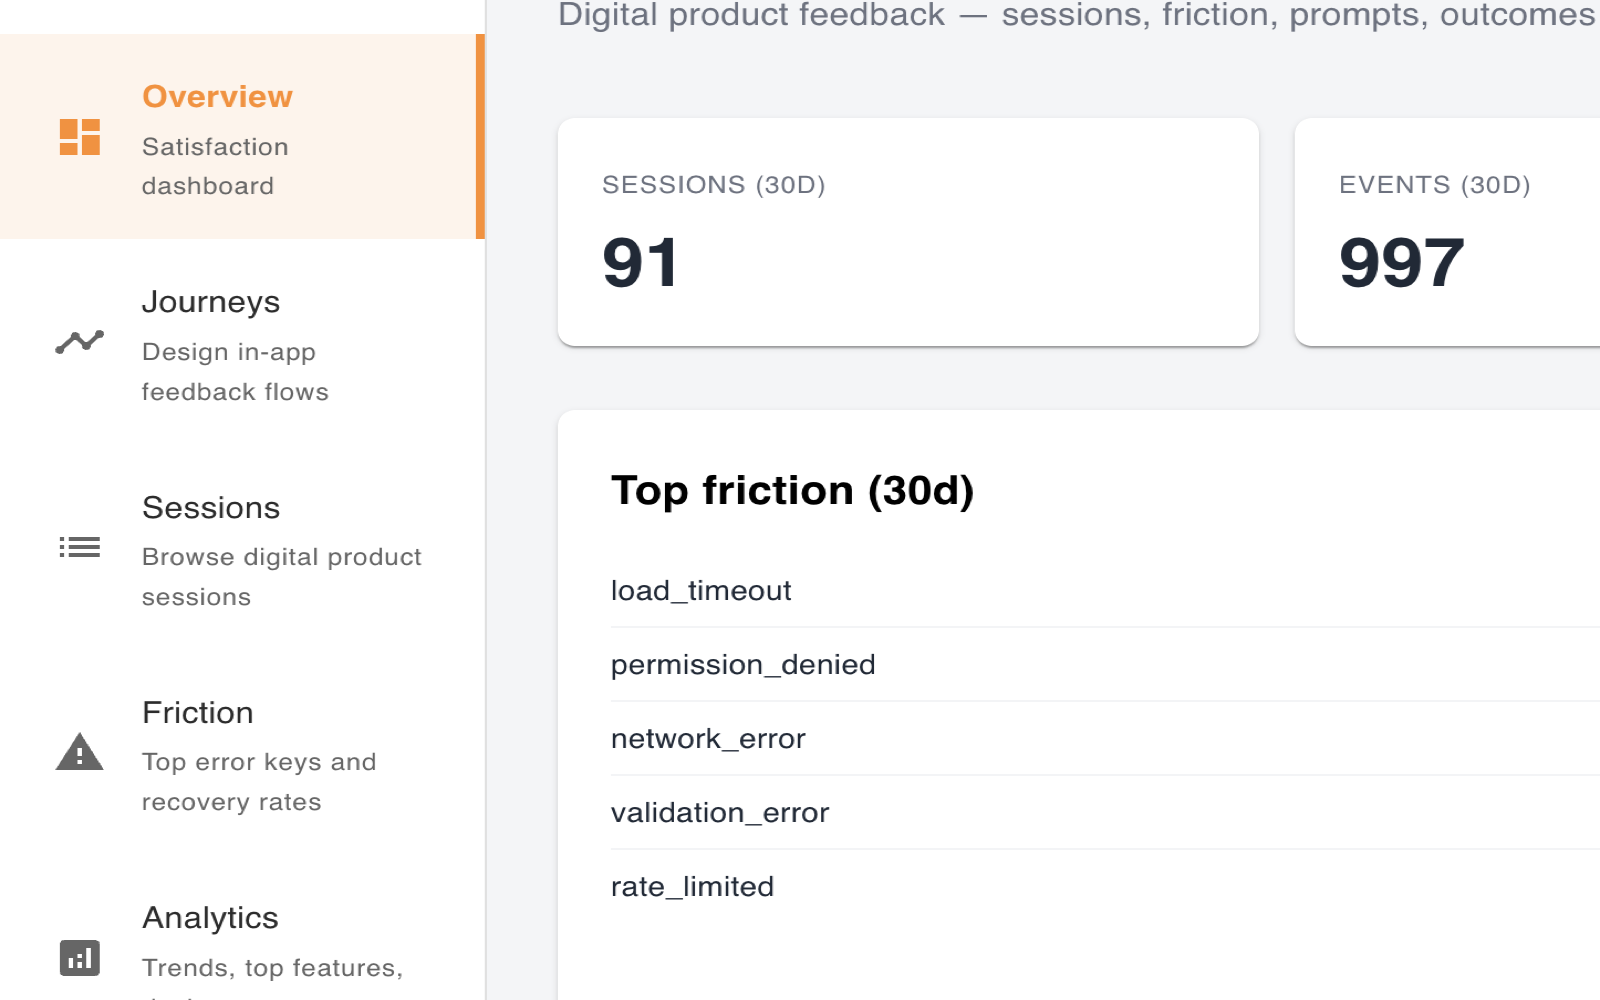
- Behavioral analytics: paths, drop-offs, engagement
- Integrated in-flow feedback tied to behavior
- UX redesign and implementation support for websites and apps
- Unified view of UX, CX, and business outcomes
What you get
Deliverables you can act on

Conversion funnel
How reach falls from landing to purchase, so the costliest drop-off in the journey is obvious.

Experience dashboard
The digital KPIs that frame performance, from visit-to-goal conversion to bounce on key entry pages.

Top friction points
The steps shedding the most users, ranked by drop-off, so engineering fixes the flows that lose conversions.

Drop-off by cause
Why users abandon, split across the underlying causes, so the biggest fix is clear.
Methodology
Page views don’t tell you where users struggle
Traffic analytics show what users clicked, not where they got stuck. We track real journeys, pinpoint friction and drop-offs in key flows, and ship the fixes, not just a report.
Standard web analytics
- Counts sessions, page views, and bounce rate
- Shows what happened, not why users struggle
- Friction in key flows stays invisible
- Hands you a dashboard, not a fix
Intellimark Digital Experience
- Tracks real user journeys across web and mobile
- Pinpoints friction and drop-offs in the flows that matter
- Ties behavior to in-flow feedback
- Includes hands-on UX redesign and implementation
Verified against established practice and research: Nielsen Norman Group, quantitative user research · Nielsen Norman Group, quant UX research in practice
Market reality
Why this matters now
Common
questions
What is Digital Experience? +
Measurement and improvement of how users move through your websites, web apps, and mobile products — from behavioral analytics that find friction to hands-on UX and build work that ships the fixes.
Do you only analyze, or can you build too? +
Both. We instrument and analyze real user behavior in the Hub, and we can redesign flows, refine your site and app, and help implement the prioritized improvements — then measure whether they worked.
How is behavior captured? +
Through native web and mobile SDKs that track journeys, funnels, and events, with in-flow feedback tied to behavior.
Who uses it? +
Product, UX, digital, and growth teams responsible for usability, conversion, and digital outcomes.
What do you get? +
A UX performance dashboard, journey and funnel analysis, identified friction points, a prioritized roadmap, and optional hands-on support to build and ship the changes.
See what digital experience can do for your team
Book a ConsultationExplore our digital experience portfolio → · See web design and development →