Analytics · Descriptive
Key Driver & Root Cause Analysis for Customer Experience
Go beyond symptoms to the few factors actually driving churn, downtime, and underperformance.
What it does
Find the drivers behind churn and dissatisfaction.
- Identify the drivers of NPS, CSAT, retention, and churn
- Quantify the impact of operational and experience variables
- Separate correlation from actual business drivers
- Prioritize actions by measurable business impact
How it works
A clear path from start to result
Define
Pin down the slipping CX metric, NPS, CSAT, or churn, and the outcome you want to move.
Gather
Unify survey feedback, journey behavior, support tickets, and operational signals.
Analyze
Model which touchpoints and experiences actually drive satisfaction, loyalty, and churn.
Prioritize
Rank the journey moments by their impact on retention and how hard they are to fix.
Act
Hand CX, ops, and frontline teams a prioritized plan to fix what hurts customers most.
Powered by the Hub
Run it continuously, on web and mobile
- Automated driver analysis across survey, operational, and behavioral data
- Real-time monitoring across journeys and segments
- Continuous tracking of changing drivers over time
What you get
Deliverables you can act on

Top Drivers
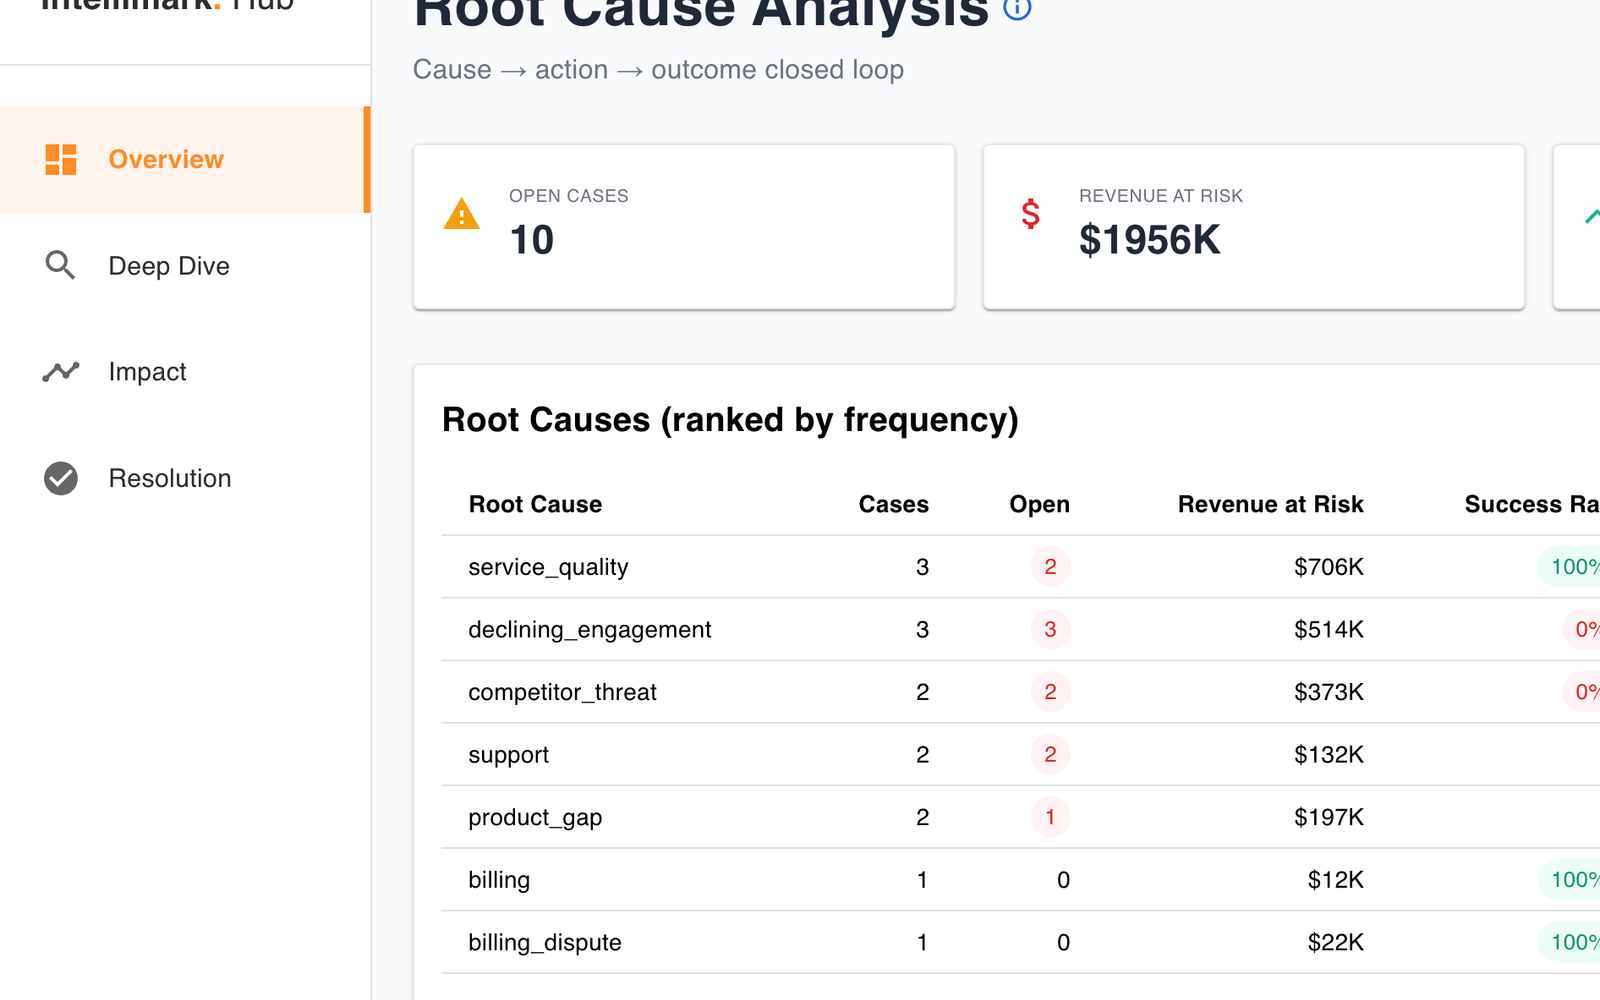
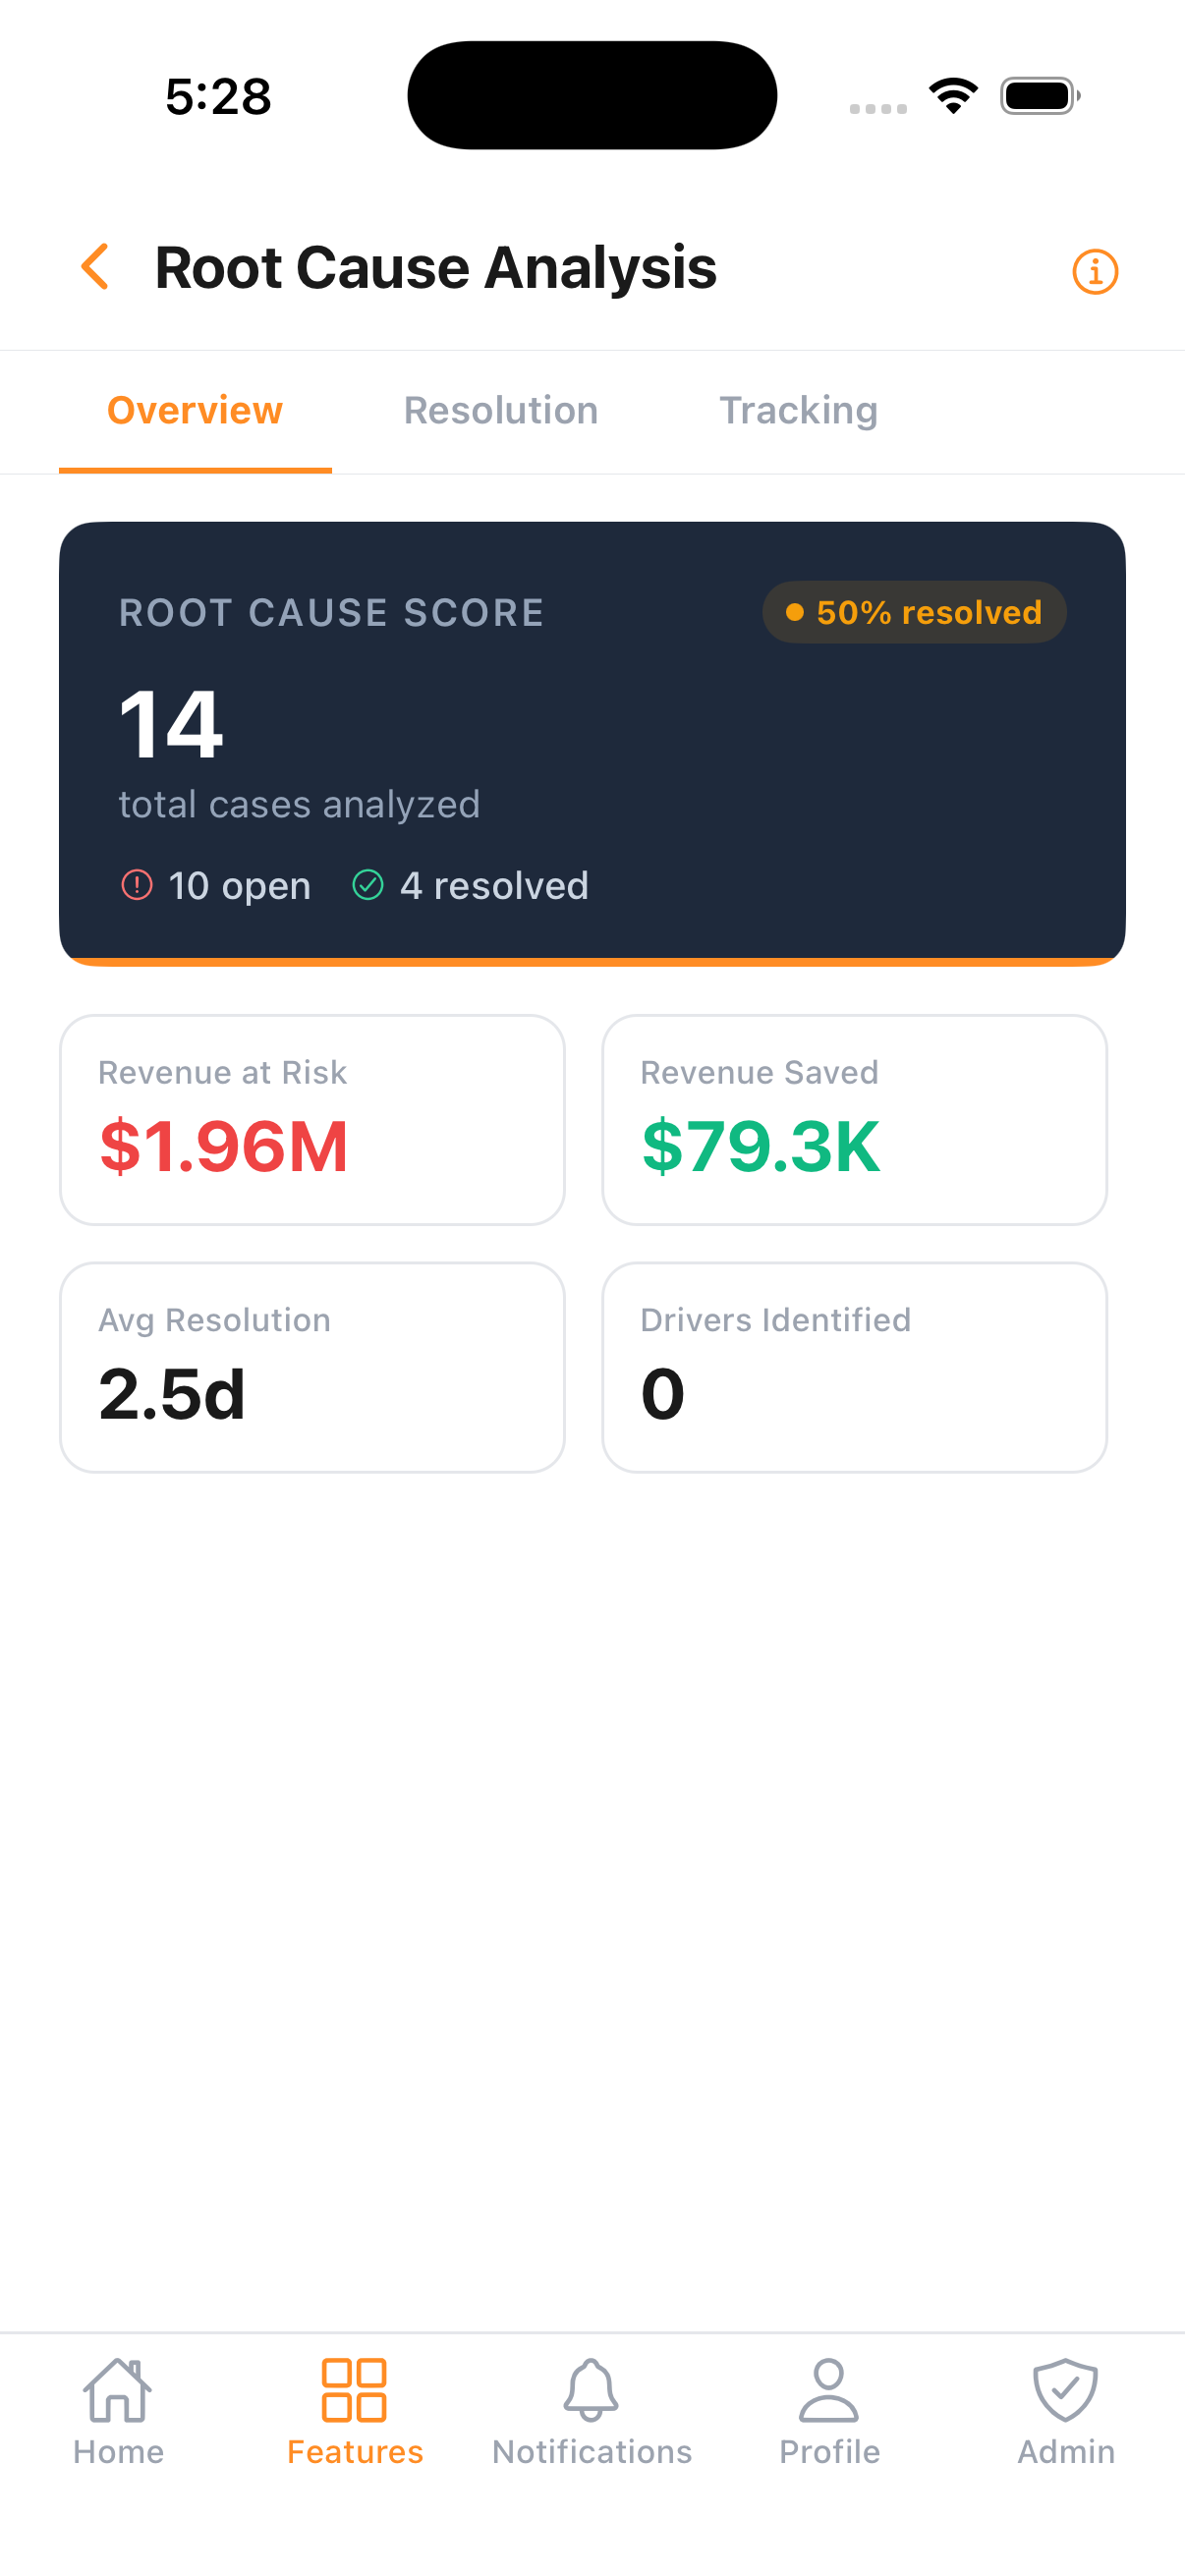
Drivers ranked by impact, with revenue at risk and saved.

Impact Analysis
Revenue at risk, customers affected, and average churn risk.

Deep Dive
Driver distribution and detailed analysis across segments.

Resolution
Prioritized initiatives tracked through to completion.
Methodology
A driver ranking isn't a root cause
Standard key driver analysis ranks the attributes that correlate with your NPS or CSAT and stops at a priority matrix, even though plain correlation skews when drivers move together. We use relative-weights importance, a Shapley-value approximation built for correlated drivers, then go further: quantify each one in revenue at risk, trace it to the operational cause, and confirm the fix moved the metric.
Standard key driver analysis
- Ranks drivers with plain correlation or regression betas
- Skews when drivers move together (multicollinearity)
- Stops at a priority matrix
- Survey data only, correlational by design
Intellimark root cause analysis
- Relative-weights importance (Shapley family), robust to correlated drivers
- Quantifies each root cause in revenue at risk and saved
- Traces the experience to its operational cause
- Tracks the fix and confirms the metric moved
Grounded in the relative-weights and Shapley consensus for correlated CX drivers: Kraha et al., multiple regression under multicollinearity (Frontiers in Psychology, 2012) · Key driver analysis, 10 things to know (MeasuringU) · Relative weights analysis (CRAN rwa vignette)
Market reality
Why this matters now
Common
questions
What is root cause analysis? +
A structured approach to finding the underlying drivers of problems rather than symptoms. We use data and diagnostic models to identify process, experience, or cross-functional causes so you can fix what actually matters.
When should you use it? +
When you face recurring issues such as complaints, churn, downtime, or inefficiency and need to target the real drivers. It is also used for post-incident review and continuous improvement.
What methods do you use? +
We combine quantitative analysis (driver models, correlation, Pareto) with qualitative review (interviews, process and journey mapping), drawing on operational logs, feedback, system data, and KPIs.
Who is involved? +
Typically operations and service owners, CX and quality teams, IT and systems support, and an executive sponsor for major issues. We tailor the framework to your teams and timelines.