Analytics · Descriptive
Customer Experience ROI: Linking CX Metrics to Financial Impact
Connect customer and employee experience to the financial KPIs leadership cares about, quantifying which drivers move revenue, churn, and retention so you can prove ROI and prioritize where it pays off.
What it does
Connect experience gains to revenue and margin.
Revenue linked to experience
We connect NPS, CSAT, and driver scores to revenue influenced by CX, revenue at risk, and growth opportunity, so experience reads as a financial line item, not a sentiment metric.
Ranked driver prioritization
Drivers like billing clarity, first contact resolution, and digital self-service are ranked by revenue impact and feasibility, so you invest in the touchpoints that change outcomes.
What-if scenario modeling
Adjust NPS and individual drivers to project revenue impact and churn reduction across a chosen horizon, with confidence bands traceable to the model coefficients.
Segment exposure mapping
Revenue at risk, NPS, and churn probability are broken out by segment and region, so high-revenue, low-loyalty accounts surface as clear retention priorities.
How it works
A clear path from start to result
Define objectives
Clarify whether retention, satisfaction, or revenue is the goal and scope which customer and employee journeys the analysis covers.
Unify the data
Bring NPS, CSAT, and eNPS together with behavioral analytics, support logs, and financial KPIs into one auditable view.
Analyze drivers
Use journey mapping, root cause analysis, and sentiment mining to surface the friction points and value moments behind each touchpoint.
Link to KPIs
Model the connection between experience metrics and revenue at risk, growth opportunity, churn, and lifetime value.
Prioritize action
Deliver a ranked action plan with revenue-lift estimates and a board view, so leadership funds the moves that pay off.
Powered by the Hub
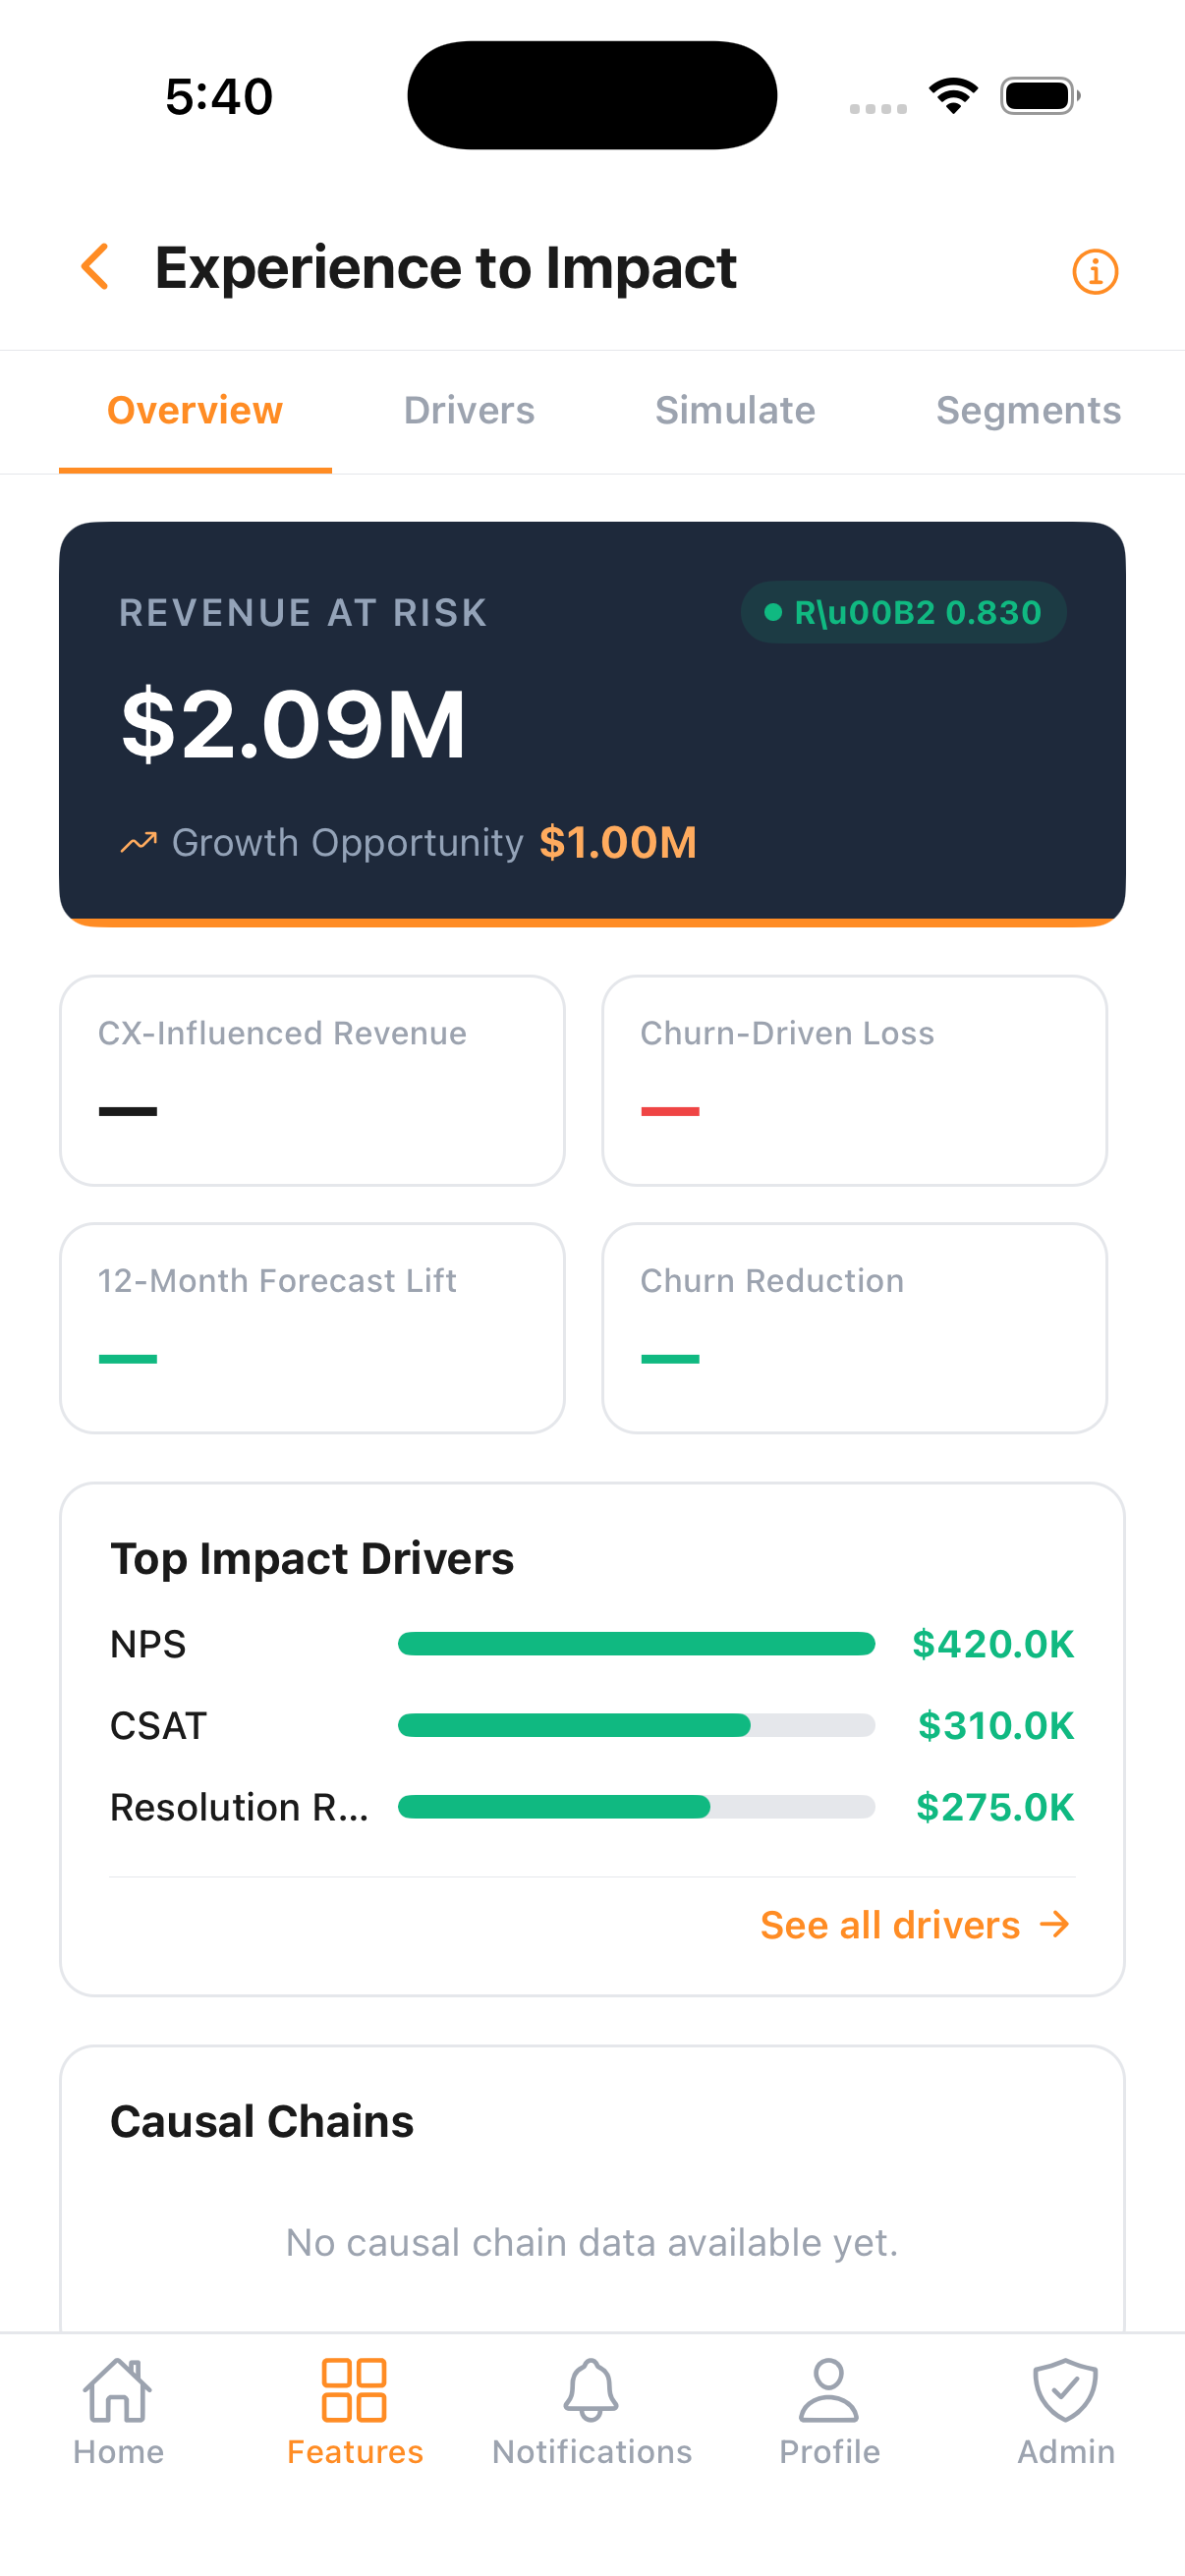
Run it continuously, on web and mobile
- Unified survey, behavioral, and operational dataset
- Revenue-at-risk and growth-opportunity visibility
- Driver analysis behind every business outcome
- CRM and workflow integration
- Continuous customer risk scoring
What you get
Deliverables you can act on

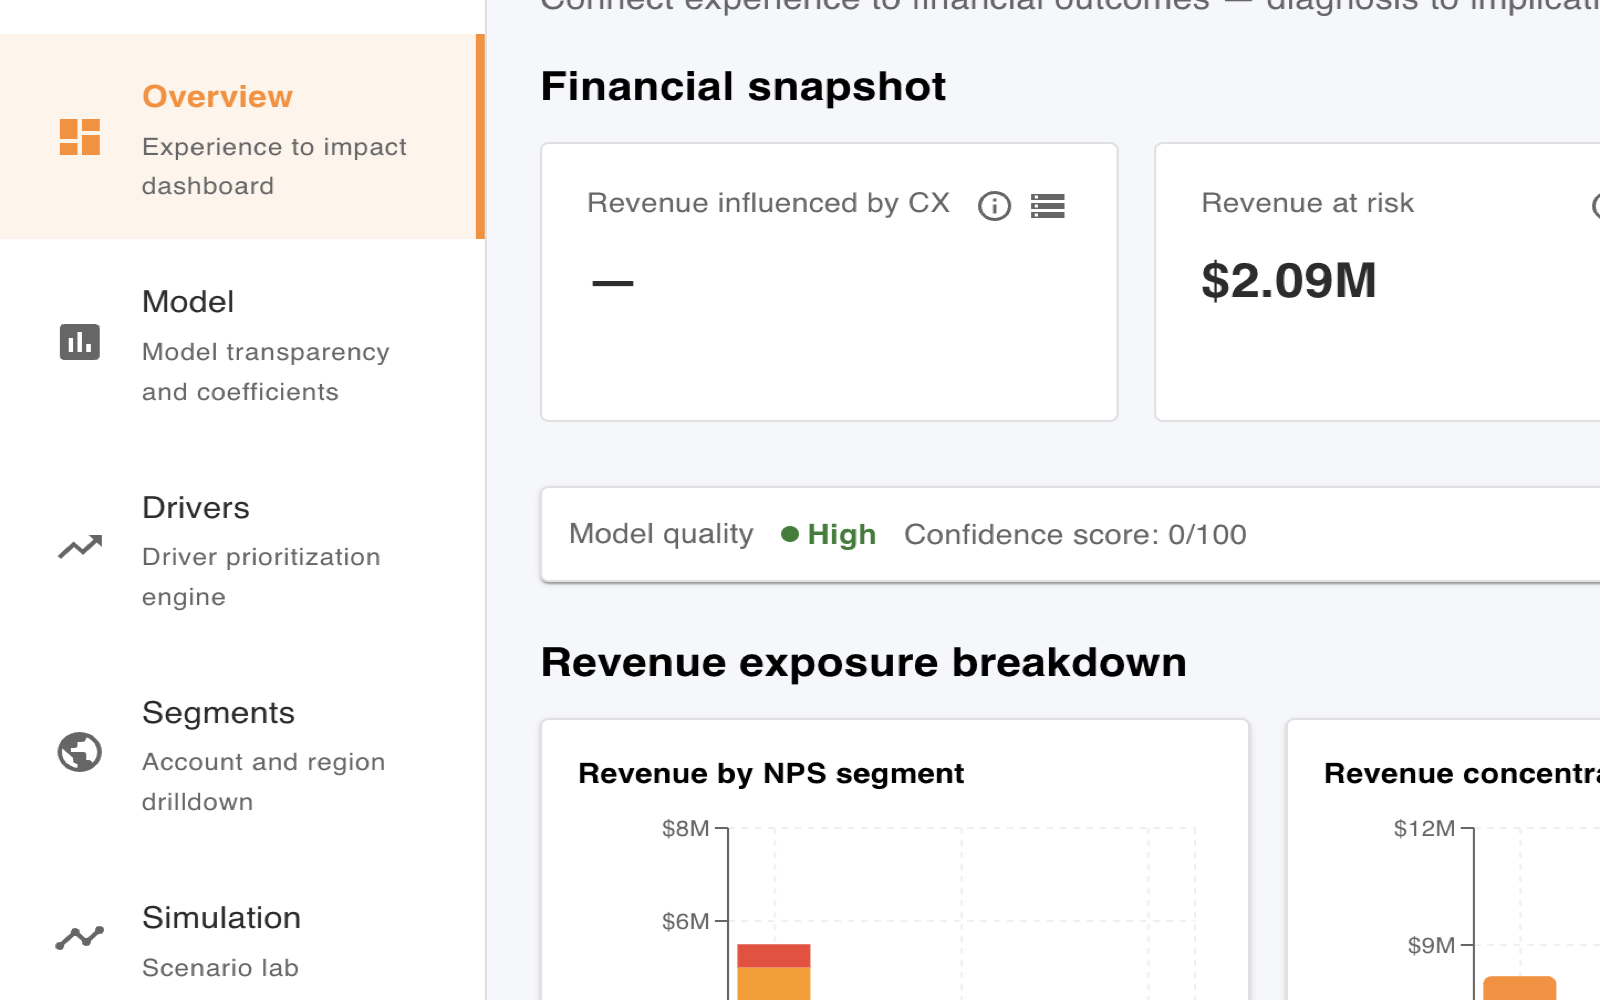
Financial snapshot
The board-level KPI cards that open the module: revenue influenced by CX alongside the revenue at risk.

Driver ranking
Experience drivers ranked by revenue impact, so prioritization starts from the touchpoints that move money.

Revenue at risk
How much revenue sits in high-risk accounts, split by risk level for triage.

Revenue by NPS segment
Revenue split across promoters, passives, and detractors, showing how much turnover depends on loyalty.
Methodology
A higher NPS means nothing the CFO can bank
Experience scores rarely survive a budget conversation. We link NPS, CSAT, and journey signals to revenue and margin, so CX reads as a financial line item, not a sentiment metric.
Experience scores in isolation
- Reports NPS and CSAT as standalone metrics
- No link to revenue, margin, or churn
- Can't prioritize spend by financial impact
- Loses the argument in the budget meeting
Intellimark Experience to Impact
- Links experience signals to revenue, churn risk, and growth opportunity
- Ranks the experience drivers that move revenue the most
- Prioritizes actions by financial impact, not score
- Gives leadership a clear ROI narrative for CX
Verified against established practice and research: Bain & Company, Net Promoter System · McKinsey, Prediction: the future of CX
Market reality
Why this matters now
$3 trillion
in global sales is at risk from poor customer experiences as customers cut spending
Qualtrics XM InstituteCommon
questions
What is Experience to Impact? +
A framework that links CX and EX data to financial outcomes such as revenue, churn, retention, and productivity. It quantifies which experience drivers matter most so you can prioritize and prove ROI.
How do you link experience to revenue? +
We combine survey data such as NPS, CSAT, and eNPS with behavioral data and financial KPIs in models that identify which touchpoints influence retention, revenue per customer, or cost.
Who uses it? +
CX and EX leaders, customer success, and strategy teams. Typical use cases include securing C-suite buy-in, reallocating budget to high-impact touchpoints, and tracking experience ROI over time.
What do you get? +
An executive board view, a ranked driver list, a what-if scenario builder, segment exposure maps, and an exportable report with prioritized actions and revenue-lift estimates.