Analytics · Descriptive
Retention Drivers
Predict which employees are most likely to leave and why, so people leaders can act on the drivers of attrition, by team and by manager, before regretted turnover hits.
What it does
Analyze engagement, retention, and productivity.
Predict who is at risk
We score every employee for attrition risk from engagement, tenure, manager, performance, and workload signals, refreshed each cycle.
Surface the real drivers
We rank the factors actually driving attrition, from career growth to manager quality and recognition, not just the surface symptoms.
See it by team and manager
Risk and drivers break down by department, location, and manager, so leaders know exactly where retention effort will pay off.
Act before they leave
We match at-risk, hard-to-replace employees to retention actions and track whether the intervention kept them.
How it works
Define
Agree which engagement, tenure, and performance signals best predict regretted attrition across your teams.
Unify
Bring HRIS, engagement surveys, performance, and manager data into one consistent view.
Score
Predict each employee’s attrition risk and refresh it every cycle.
Explain
Surface the drivers pushing each person and team toward leaving.
Act
Hand managers a prioritized plan to retain the people who matter most.
Powered by the Hub
Run it continuously, on web and mobile
- Unified retention dataset across CX and operations
- Automated driver analysis across signals
- Segment-level retention and risk breakdowns
- Continuous monitoring of changing drivers
- Executive dashboards and mobile access
What you get

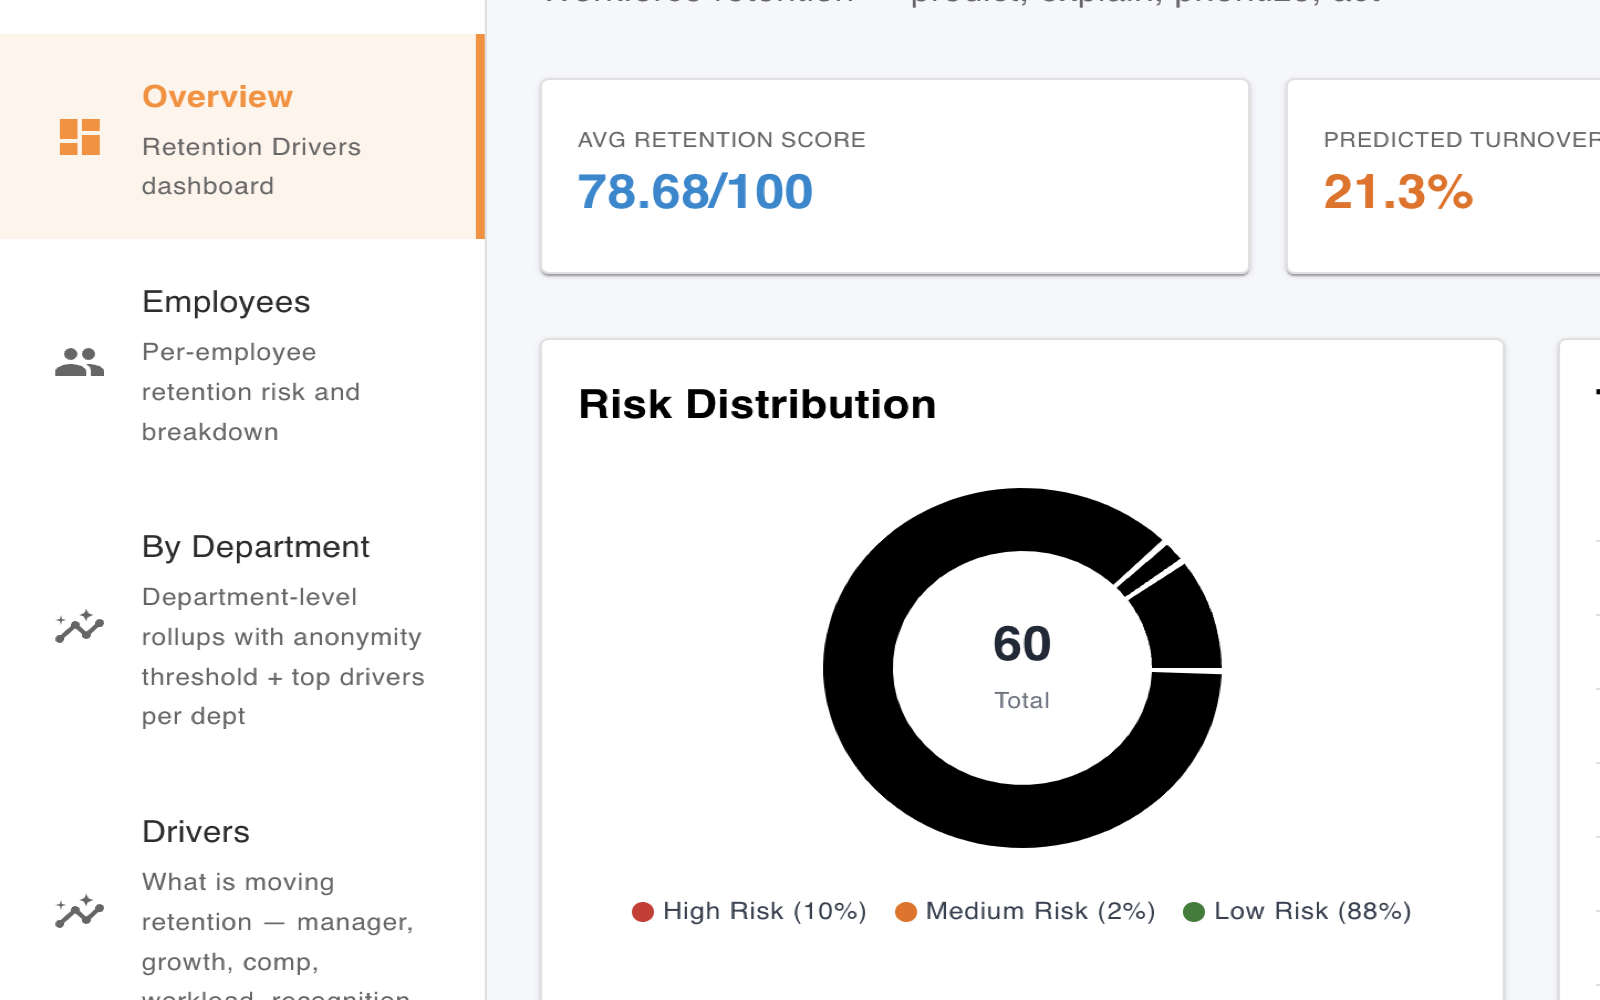
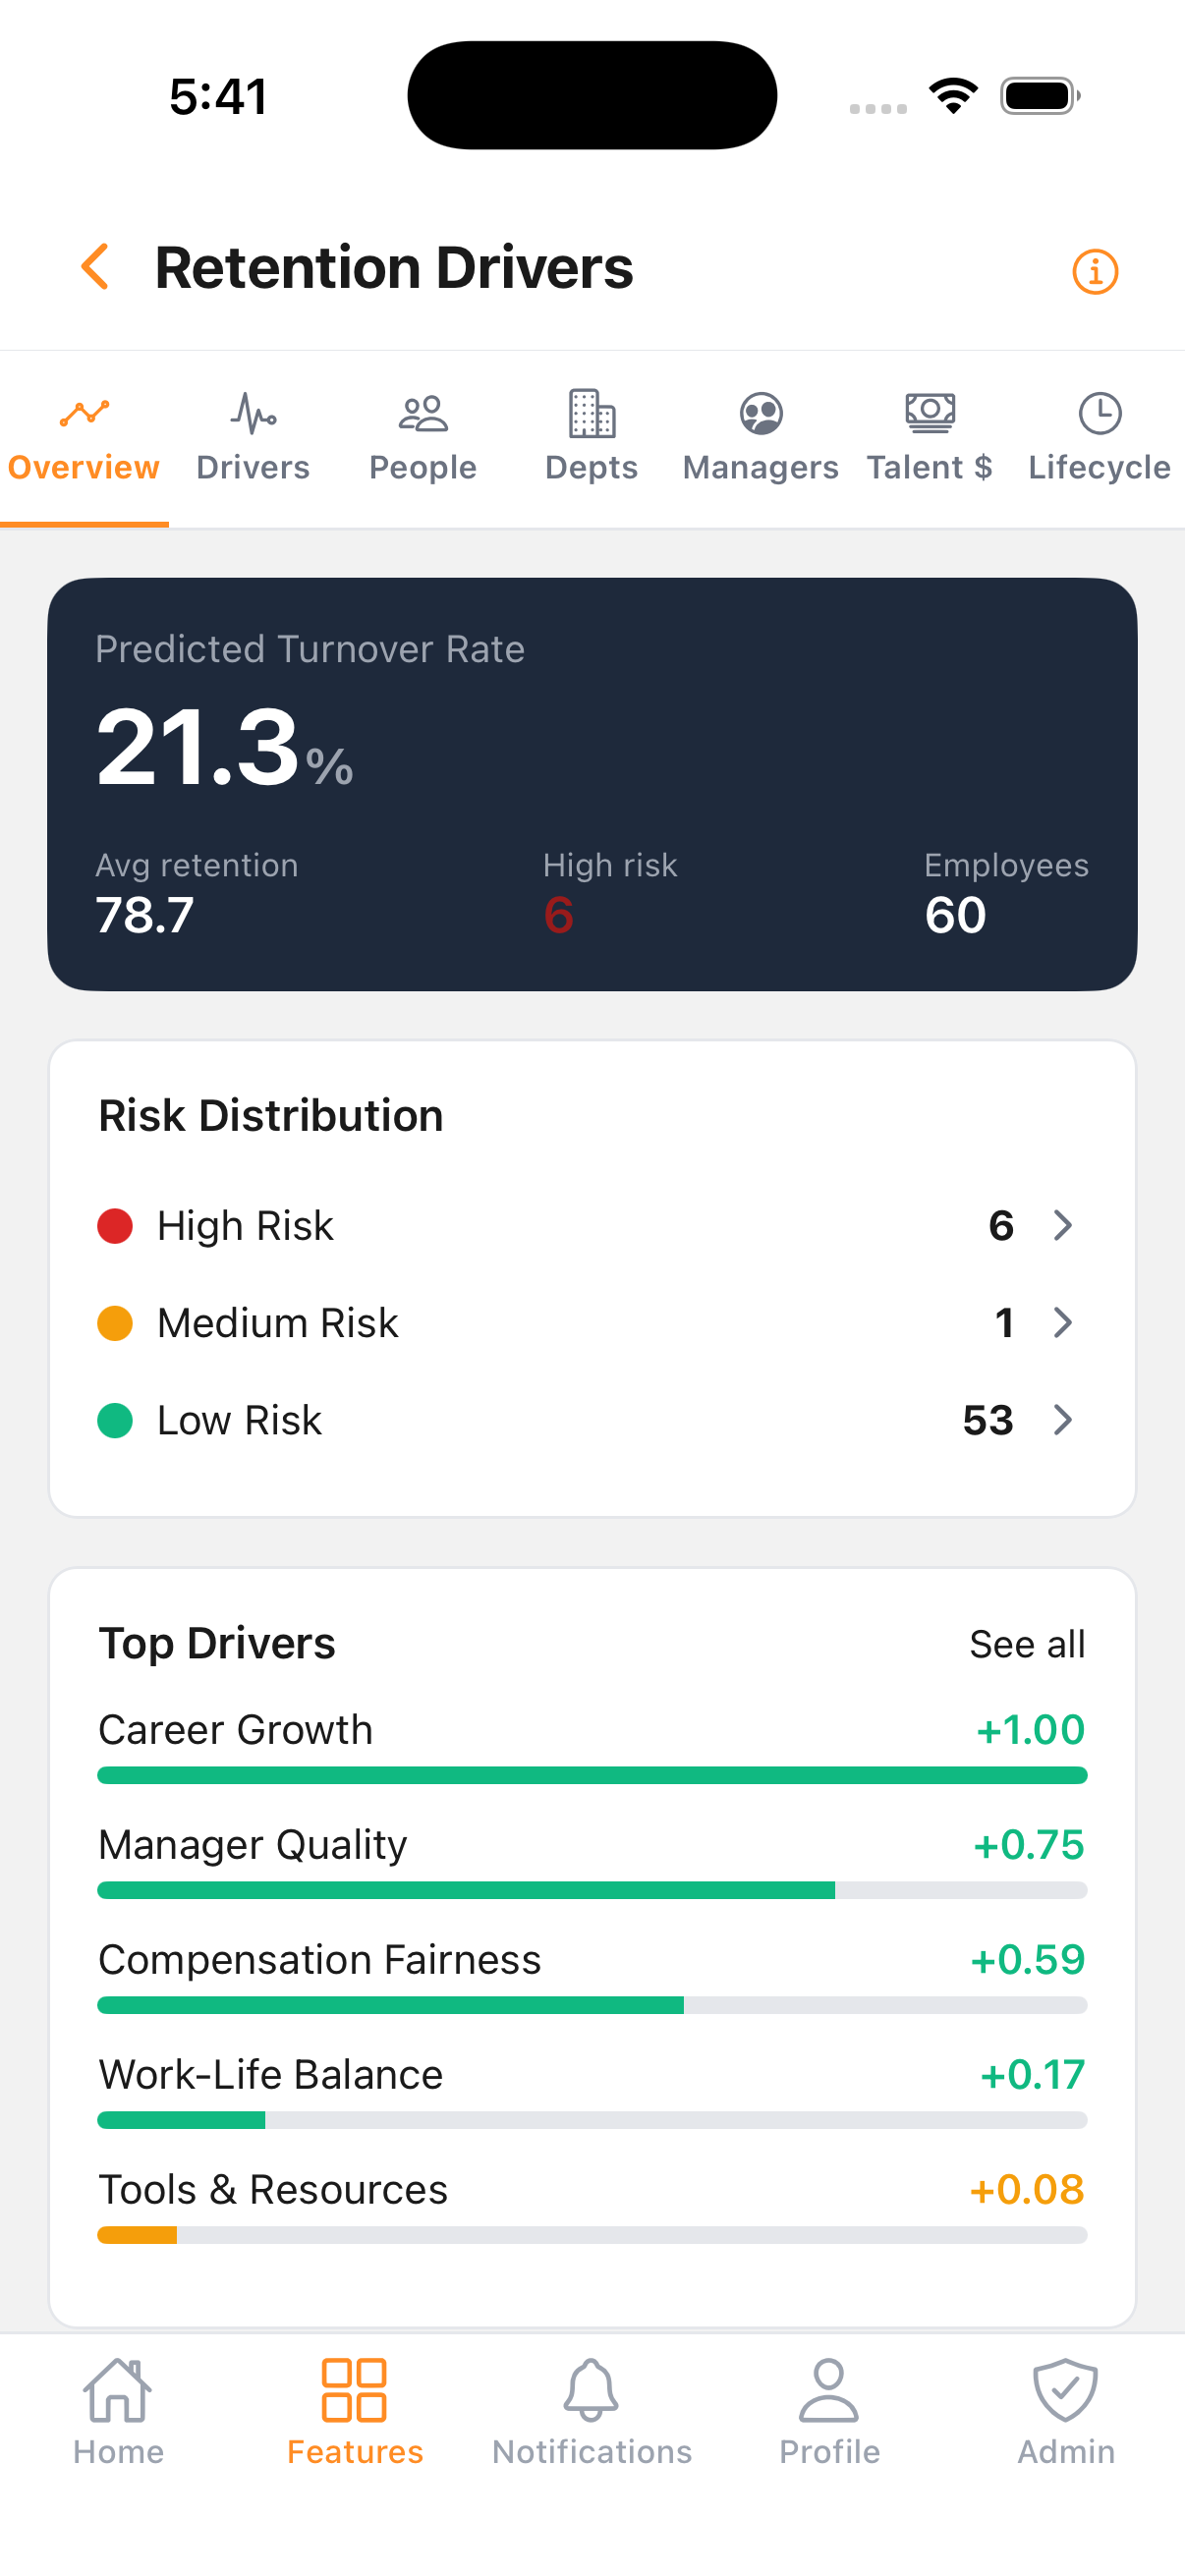
Attrition risk
The workforce split into high, medium, and low flight risk, with the predicted turnover rate for the period.

Top retention drivers
The factors most responsible for attrition, ranked by impact, so action targets the real cause.

Retention by department
Each department scored on its retention health, so leaders see which teams need focus first.

Risk by tenure
Where attrition risk concentrates across tenure bands, so retention effort lands where flight risk is highest.
Common
questions
What is retention driver analysis? +
It uses engagement, tenure, manager, and performance signals to predict which employees are likely to leave and why, so you can act before regretted turnover.
How is attrition risk calculated? +
A model trained on your historical turnover and engagement data scores each employee, and we surface the drivers behind every score, broken down by team and manager.
Who uses it? +
People and HR leaders, talent teams, and managers who own engagement and retention, especially where regretted attrition is costly and hard to replace.
How does it reduce turnover? +
By flagging at-risk, hard-to-replace employees early and matching each to a retention action, then tracking whether the intervention kept them.