Analytics · Predictive
Churn Modeling
Uses behavioral, operational, and experience signals to predict churn risk and support proactive retention strategies.
What it does
Flag customers likely to leave, in time to act.
Predict who is at risk
Score every customer for churn risk from behavioral, usage, support, and experience signals, refreshed continuously.
Catch early warning signs
Surface the leading indicators of churn weeks before they show up in lost revenue or a cancelled renewal.
Focus on high-value saves
Rank at-risk accounts by value and likelihood so the team spends its time where retention pays off most.
Act with the right play
Match each at-risk account to a retention play, then track whether the intervention actually moved the metric.
How it works
Unify
Bring usage, support, billing, and experience signals into one view.
Score
Predict the churn risk for every customer, refreshed continuously.
Explain
Surface the drivers pushing each account toward leaving.
Prioritize
Rank at-risk, high-value accounts so the team focuses where it counts.
Act
Trigger the right save play and track whether it moved the metric.
Powered by the Hub
Run it continuously, on web and mobile
- Unified dataset combining survey, behavioral, and operational signals
- Machine learning models trained on real CX and usage data
- Continuous scoring across the full customer base
- Integration into CRM, journeys, and decision workflows
What you get

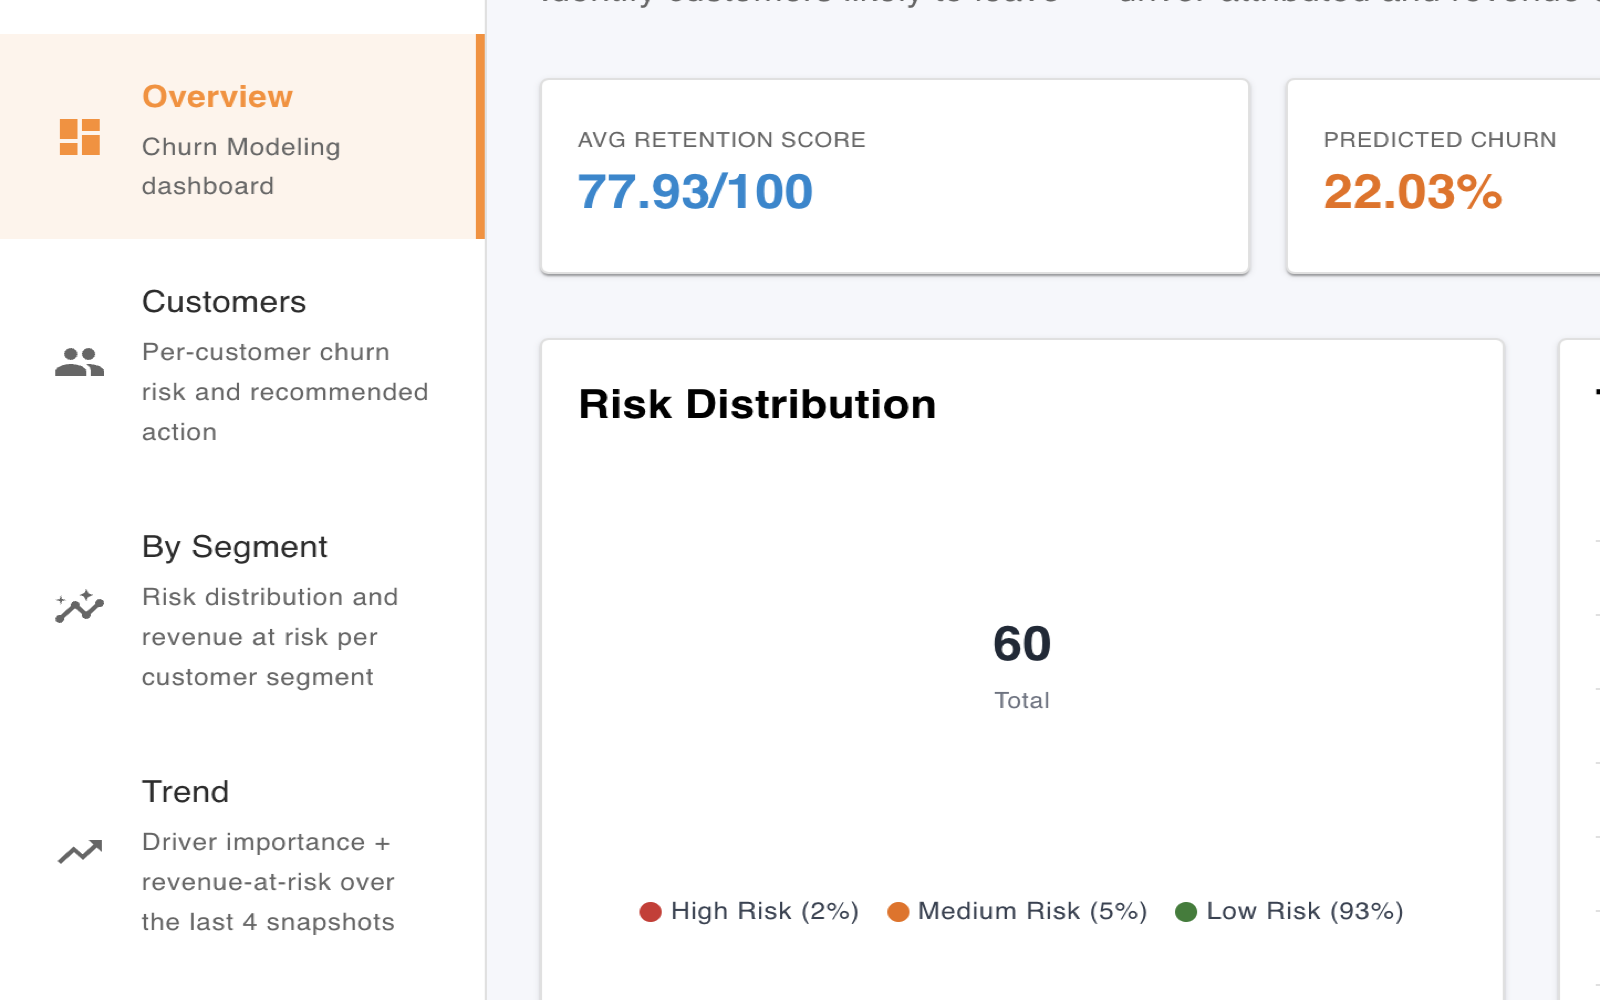
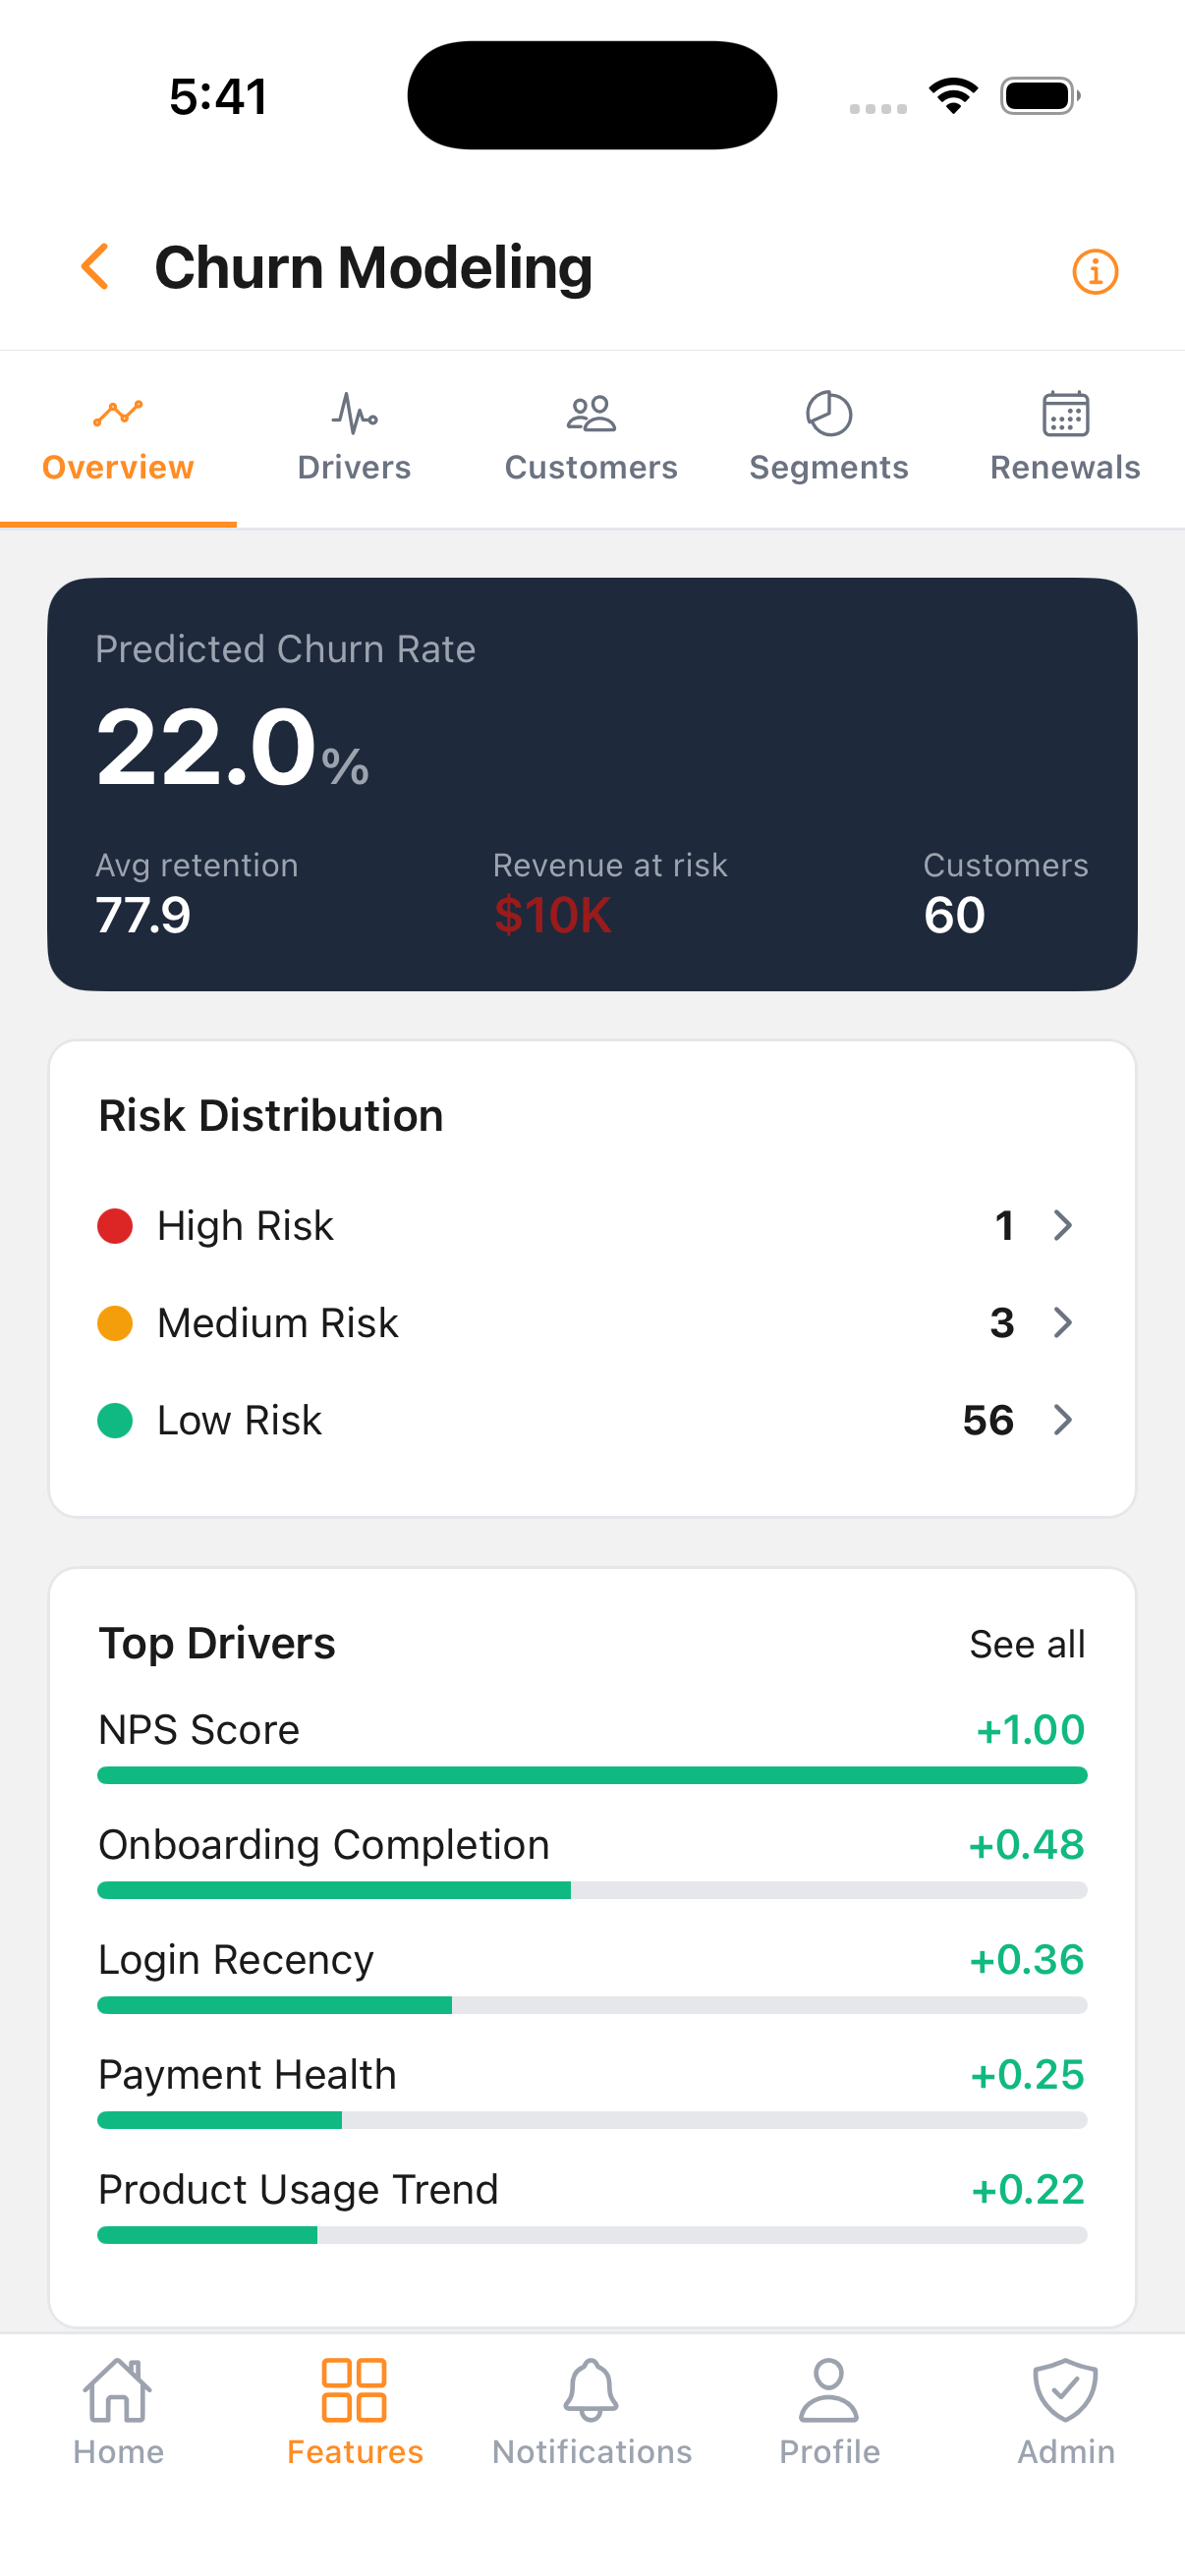
Risk Distribution
High, medium, and low risk across your whole base.

Top Churn Drivers
What is pushing customers to leave, ranked by impact.

At-Risk Customers
Per-customer churn scores, prioritized by value.

Save Plays
Retention actions matched to each risk, tracked to outcome.
Market reality
Why this matters now
Common
questions
What is churn modeling? +
It uses behavioral, operational, and experience signals to predict which customers are likely to leave, so you can act before they do.
How is churn risk calculated? +
A model trained on your historical churn and usage data scores each customer, and we surface the drivers behind every score, not just the number.
Who uses it? +
Customer success, retention, and growth teams, especially in subscription, contract, and high-value B2B where retention drives revenue.
How does it improve retention? +
By flagging at-risk, high-value accounts early and matching each to a save play, then tracking whether the intervention moved the metric.