
Most CX programs measure whether a problem was identified or a case was closed. Far fewer measure whether the resolution actually reached the customer.
We analyzed U.S. automotive recall data because it provides something most industries do not: a publicly reported outcome showing whether the customer actually received the fix.
The difference is substantial. Recalls that could be resolved through an over-the-air software update reached 95.1% completion after four quarters, compared with 56.8% for recalls requiring the owner to take the vehicle in for service. Even within Tesla, where the manufacturer is held constant, completion was 98.4% versus 68.7%.
The analysis does not claim that customer effort alone caused the entire gap. Vehicle age, reachability, parts availability, fault type and other factors matter.
But the broader CX finding is difficult to ignore: a resolution is only valuable if it actually reaches the customer. Organizations should therefore measure not only cases closed, but resolution completion by delivery route and the number of actions required from the customer.
The one industry required to publish whether its fixes land
A carmaker finds a fault. By law it must repair every affected vehicle free of charge, and it must report to the regulator how many owners actually got the repair. Almost no other industry is required to publish whether its fixes reached anyone at all.
Across roughly 4,000 campaigns, measured over the full life of a campaign. The series stops at 2024 on purpose: repair rates keep climbing for years after a recall is issued, so 2025 campaigns have not settled yet and plotting them would show how recent they are rather than how well they were repaired.
This is the industry’s settled baseline, not a recent deterioration and not a story about one bad year. The rate has sat between 77% and 87% for a decade, the years before 2015 look the same, and none of it is contested. Across ten to fifteen years of changing vehicles, dealer networks and notification methods, the share of owners who eventually get a free, legally mandated repair has barely moved. That stability is what makes the number usable: anything that shifts it is a real effect, not noise. NHTSA’s own published average across all recalls is 64%, rising to 83% for new vehicles. Our own figure is lower at 58.6%, because we cut every campaign at four quarters so that recent recalls are not compared against mature ones. Carfax counts 58.1 million US vehicles carrying an open recall today, roughly one in five on the road.
So we took every US light-vehicle recall old enough to measure and split it by a dimension NHTSA does not report: how much the owner had to do to get the repair.
The cost of asking the customer to show up
Every recall has one of two remedies. Some are software faults, fixed by an update sent to the car overnight, which asks the owner for nothing. The rest need the vehicle physically brought in.
Software sent to the car · 59 campaigns · 17.1M vehicles
Book and attend a service visit · 3,156 campaigns · 345.4M vehicles
Take Tesla out and it is still 89% against 57%
Tesla accounts for 65% of over-the-air volume, so the obvious objection is that the whole result is one unusual company. Take Tesla out completely and the remaining over-the-air repairs still reach 88.9%, against 56.8% for repairs that need a service visit.
38 campaigns · 6.0M vehicles repaired over the air
21 campaigns · 11.1M vehicles repaired over the air
3,156 campaigns · 345.4M vehicles needing a service visit
These are the ten manufacturers that make up the non-Tesla remainder.
| Manufacturer | Campaigns | Vehicles covered | Share |
|---|---|---|---|
| Mercedes-Benz USA | 7 | 1,949,206 | 32.5% |
| General Motors | 10 | 1,938,021 | 32.3% |
| Stellantis (FCA US) | 2 | 1,353,043 | 22.6% |
| Volvo Car USA | 3 | 458,017 | 7.6% |
| Ford Motor Company | 7 | 135,712 | 2.3% |
| Nissan North America | 3 | 75,101 | 1.3% |
| Hyundai Motor America | 3 | 58,126 | 1.0% |
| Kia America | 1 | 14,163 | 0.2% |
| Rivian Automotive | 1 | 7,873 | 0.1% |
| American Honda | 1 | 4,174 | 0.1% |
| Ten manufacturers | 38 | 5,993,436 | 100% |
We publish no completion rate for each manufacturer individually because most hold only one to three qualifying campaigns, which is too few to rate. What survives every objection we could put to it is that the gap holds with the manufacturer held constant: inside Tesla alone it is 29.7 points, and across these ten it is 32.2.
The path that works covers one vehicle in twenty
Repairs that ask nothing of the owner reach 95.1%. They are also almost never the option available. Nearly every recalled vehicle is on the path that needs the owner to act, and that is where the repairs stop landing.
Column width is share of vehicles. Fill height is the share of those vehicles repaired.
149.4Mnever repaired · 43.2%
196.0Mrepaired · 56.8%
345.4M vehicles – owner had to act
95.3% of everything recalled
The narrow column is every recall repaired by a software update sent to the car: 4.7% of the volume, almost all of it fixed. The wide column is every recall that needed a service visit. Vehicle counts are campaign-vehicle pairs: one car covered by three campaigns counts three times. Source: NHTSA quarterly recall completion reports and NHTSA recall API.
This is the shape of most customer experience problems. The mechanism that works is known, proven, measured, and deployed on a rounding error of the actual volume. The constraint is not evidence. It is that the remaining 95% of repairs still require the owner to do the work, and most manufacturers depend on an independent business to persuade them to do it.
A fix that never arrives is indistinguishable from a fix you never made.
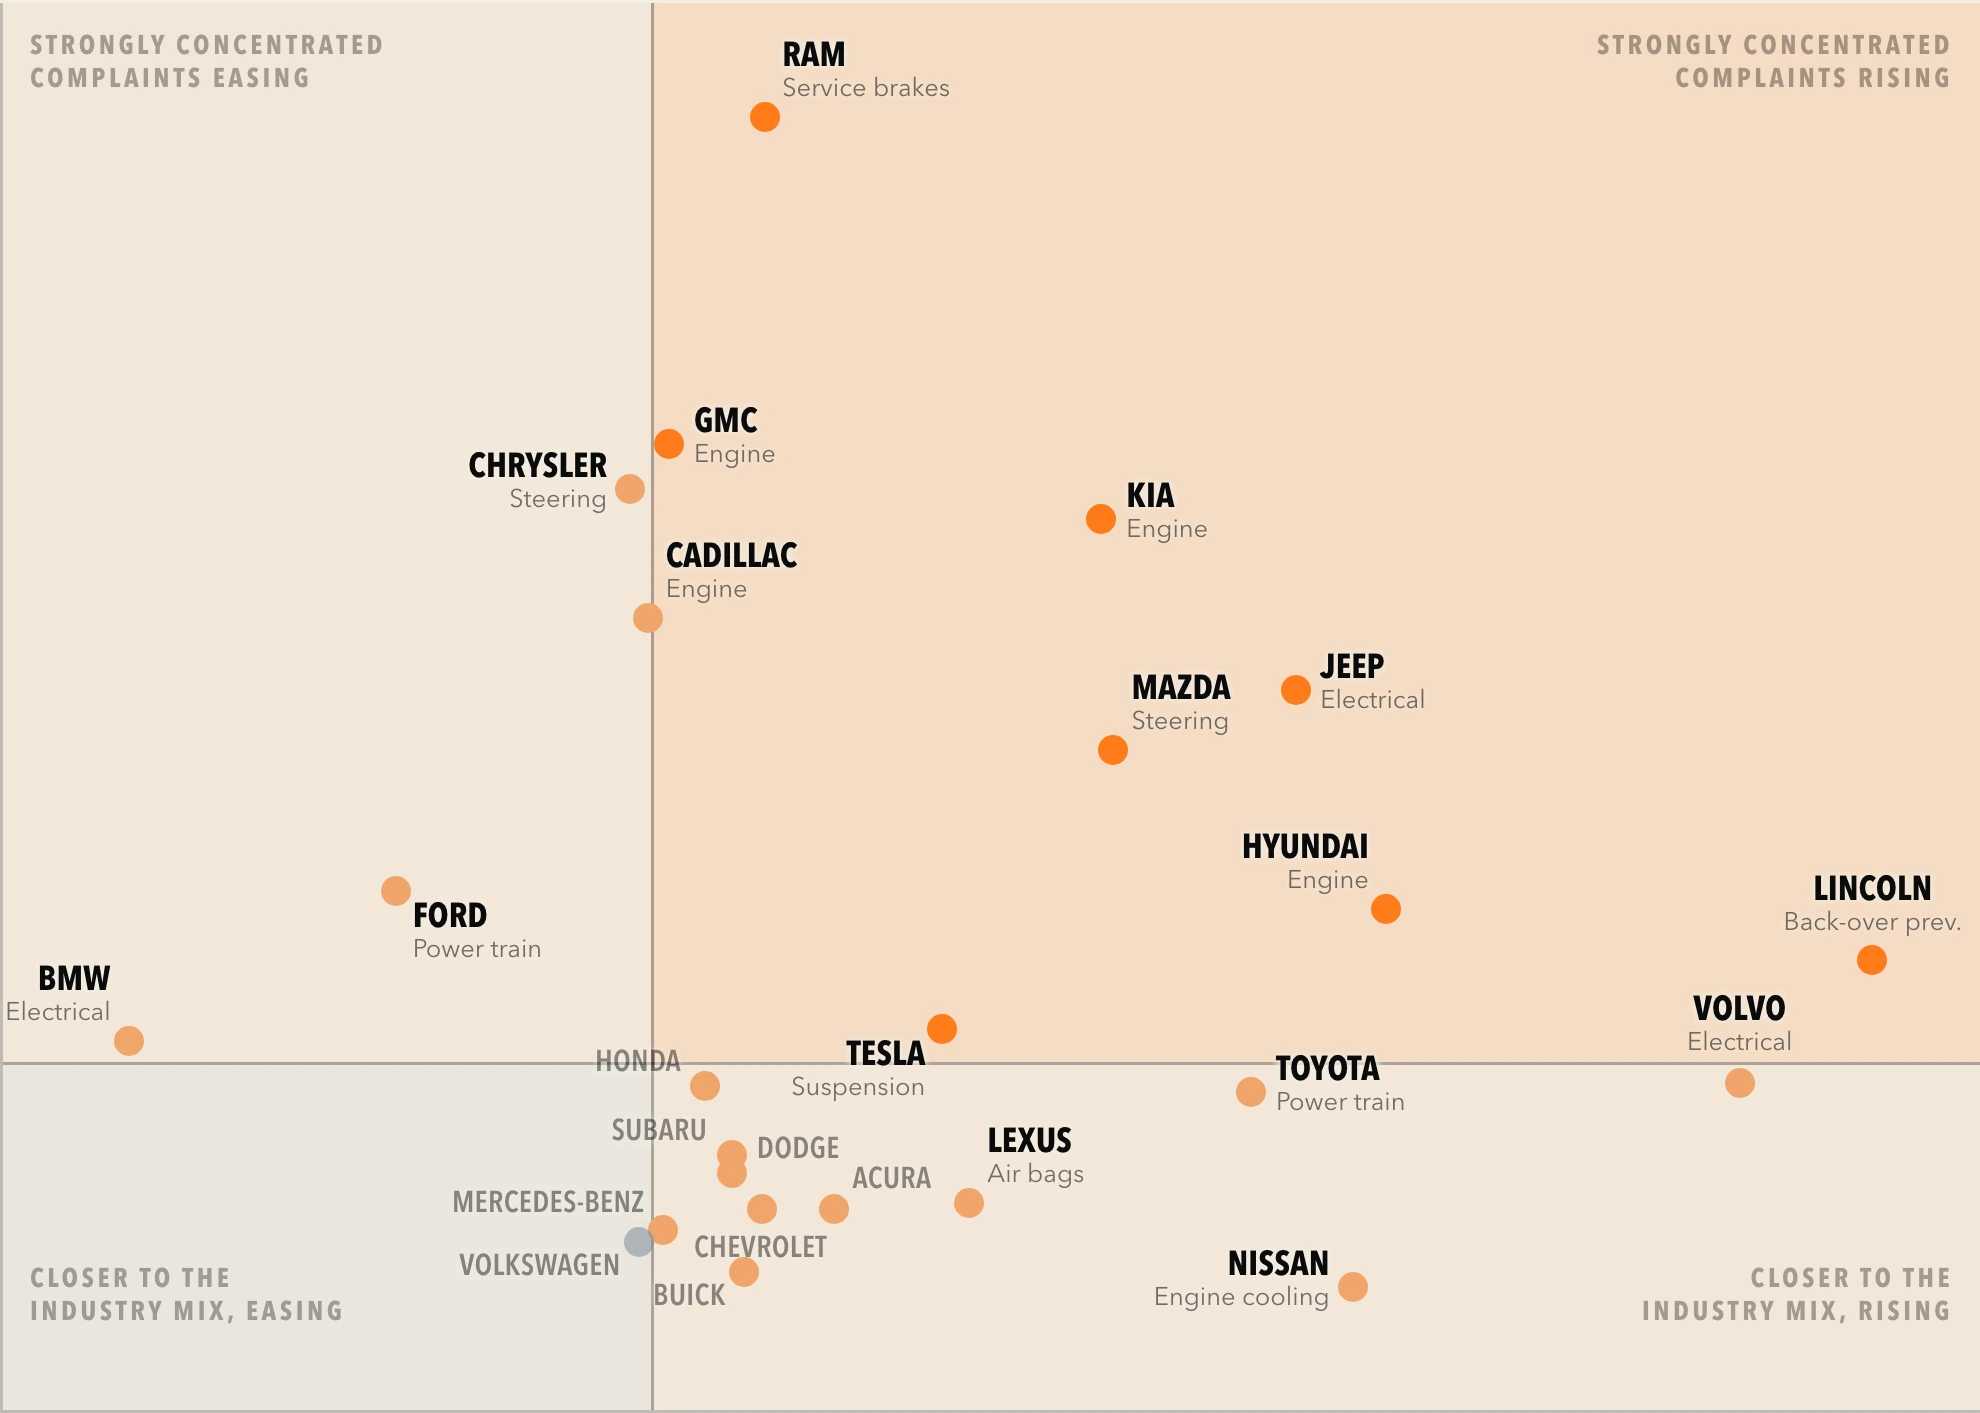
A different question: whose complaints pile into one component?
Effort tells us whether the fix lands. Complaint mix tells us where to look next. The vertical axis is how far a brand’s worst component sits above the rate for all 25 brands. The horizontal axis is whether complaints are rising or falling against that brand’s own prior year.
How we worked this out, and where it could be wrong
Every figure in this report is computed from public sources. Nothing here is licensed, modelled or estimated.
59
- Reported for four full quarters
- 8,368 – 100% of the start.
- Light vehicles in scope
- 3,215 – 38% of the start. 5,153 removed as not light vehicles, or built by an upfitter or converter.
- Repairable over the air
- 59 – 1% of the start. 3,156 removed as needing the vehicle physically brought in.
Completion comes from NHTSA quarterly recall completion reports, measured at a fixed campaign age of four quarters so recent campaigns are not compared against mature ones, and weighted by vehicles covered rather than by campaign count. Campaigns issued October 2013 to June 2025, reported through 2026 Q2. Remedy path comes from the NHTSA recall API over-the-air field, retrieved for every in-scope campaign, with complete coverage and no missing values. Components use NHTSA COMPDESC as assigned, with sibling categories merged on the root before the first comma or colon; hydraulic brakes fold into service brakes and the unspecified catch-all is excluded. Scope is light vehicles only, with upfitters, van converters and wheelchair-accessible vehicle modifiers excluded and manufacturer names normalised before aggregation.
Eight reasons this could be overstated
Every one of these pushes in the direction of making the gap look bigger than it is. They are listed so a reader can discount the result themselves.
Vehicle age
0180% vs 56%
completion for cars under three years old against cars six to ten years old
Cars able to update themselves are newer, and newer cars complete more often whatever the path. Some of this gap is age, not effort.
Reachability
02Not measured
no public data on address quality by vehicle age
A connected car has a live account and a current address. A fifteen-year-old car on its third owner may have neither, and the manufacturer simply knowing where the customer is will carry some of the result.
Parts delay
03Not measured
interim notices are not flagged in the public file
Physical recalls are sometimes announced before the parts exist, which suppresses completion at four quarters for reasons that have nothing to do with the customer. Software remedies have no parts constraint.
Fault type
04By definition
the two paths cannot carry the same repair
Software-remediable defects are a different class of fault from a part replacement. This compares two paths carrying different repairs, not two routes to an identical one.
No denominator
050 of 25
brands have a public US fleet-size figure
The brand complaint chart therefore has no exposure denominator. Read it as where a brand's own complaints concentrate, never as a defect rate.
Small sample
0638 campaigns
and three makers hold 87% of the vehicles in them
Mercedes-Benz, General Motors and Stellantis dominate the group, so removing Tesla does not leave ten evenly weighted manufacturers behind it.
Not random
0711 makers
issued a software remedy at all in this period
They are the firms that had connected fleets to attempt one, which means newer fleets, which is the same bias as vehicle age above.
How we count
080.59
rank correlation between a four and eight quarter window
Manufacturer rankings are not stable, so none is published. Vehicle counts are also campaign-vehicle pairs: one car in three campaigns counts three times.
Three questions to ask about your own business
A regulator counts this for carmakers. For everyone else it has to be measured deliberately. These are the questions this analysis is the automotive version of.
-
01
What share of your resolutions actually reach the customer?
Not cases closed. Not responses sent. The share where the customer received the outcome and it took effect. Almost every CX programme measures whether a problem was found; very few measure whether the fix landed. Automotive has a legal mandate, a funded repair and a tracked outcome, and still reaches 56.8% when the customer has to act.
-
02
How does that rate differ by delivery route?
Tesla's own recalls run 98.4% when nothing is asked of the owner and 68.7% when a service visit is. Same manufacturer, same four-quarter measurement window. Because the company is held constant, that is the comparison worth running inside your own operation, on your own delivery routes.
-
03
How many actions does the customer have to take?
Count them. Four required actions versus none coincided with a gap of nearly forty points. Step count is one variable you can control.
Sources. NHTSA recall completion reporting and Reports to Congress; NHTSA recall API; NHTSA ODI complaint database; GAO-24-106356; Carfax open-recall figures, January 2025.
